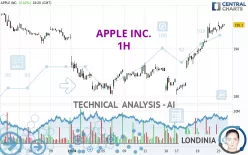
APPLE INC. - 1H - Technical analysis published on 01/23/2024 (GMT)
- 177
- 0
Click here for a new analysis!
- Timeframe : 1H
- - Analysis generated on
- Status : LEVEL MAINTAINED

Summary of the analysis

Additional analysis
Quotes
The APPLE INC. rating is 195.16 USD. The price has increased by +0.66% since the last closing and was traded between 193.83 USD and 195.75 USD over the period. The price is currently at +0.69% from its lowest and -0.30% from its highest.Here is a more detailed summary of the historical variations registered by APPLE INC.:
Near a new HIGH record (5 years)
Type : Bullish
Timeframe : Weekly
Near a new HIGH record (1 year)
Type : Bullish
Timeframe : Weekly
New HIGH record (1st january)
Type : Bullish
Timeframe : Weekly
Near a new HIGH record (1 month)
Type : Bullish
Timeframe : Weekly
Technical
A technical analysis in 1H of this APPLE INC. chart shows a strongly bullish trend. The signals given by the moving averages are 92.86% bullish. This strong bullish trend is confirmed by the strong signals currently being given by short-term moving averages. The Central Indicators market scanner currently does not detect any result that concerns moving averages.
In fact, 12 technical indicators on 18 studied are currently positioned bullish. Caution: the Central Indicators scanner currently detects an excess:
RSI indicator is overbought : over 70
Type : Neutral
Timeframe : 1 hour
Williams %R indicator is overbought : over -20
Type : Neutral
Timeframe : 1 hour
The Central Patterns scanner, which studies chart patterns, resistances and supports, has identified this signal:
Near resistance of channel
Type : Bearish
Timeframe : 1 hour
The Central Candlesticks scanner currently notes the presence of this pattern in Japanese candlesticks that could mark the end of the short-term trend currently underway:
Doji
Type : Neutral
Timeframe : 1 hour
| S3 | S2 | S1 | Price | R1 | R2 | R3 | |
|---|---|---|---|---|---|---|---|
| ProTrendLines | 187.05 | 189.42 | 191.09 | 195.16 | 195.93 | 197.68 | 199.62 |
| Change (%) | -4.16% | -2.94% | -2.09% | - | +0.39% | +1.29% | +2.29% |
| Change | -8.11 | -5.74 | -4.07 | - | +0.77 | +2.52 | +4.46 |
| Level | Minor | Minor | Minor | - | Major | Minor | Intermediate |
To determine price objectives, it is also possible to use the pivot points. Here is the price position in relation to pivot points:
| Pivot points | S3 | S2 | S1 | PP | R1 | R2 | R3 |
|---|---|---|---|---|---|---|---|
| Standard | 189.25 | 190.76 | 192.32 | 193.83 | 195.39 | 196.90 | 198.46 |
| Camarilla | 193.05 | 193.33 | 193.61 | 193.89 | 194.17 | 194.45 | 194.73 |
| Woodie | 189.29 | 190.77 | 192.36 | 193.84 | 195.43 | 196.91 | 198.50 |
| Fibonacci | 190.76 | 191.93 | 192.65 | 193.83 | 195.00 | 195.72 | 196.90 |
| Pivot points | S3 | S2 | S1 | PP | R1 | R2 | R3 |
|---|---|---|---|---|---|---|---|
| Standard | 172.27 | 176.29 | 183.92 | 187.94 | 195.57 | 199.59 | 207.22 |
| Camarilla | 188.36 | 189.42 | 190.49 | 191.56 | 192.63 | 193.70 | 194.76 |
| Woodie | 174.09 | 177.19 | 185.74 | 188.84 | 197.39 | 200.49 | 209.04 |
| Fibonacci | 176.29 | 180.74 | 183.49 | 187.94 | 192.39 | 195.14 | 199.59 |
| Pivot points | S3 | S2 | S1 | PP | R1 | R2 | R3 |
|---|---|---|---|---|---|---|---|
| Standard | 174.61 | 181.03 | 186.78 | 193.20 | 198.95 | 205.37 | 211.12 |
| Camarilla | 189.18 | 190.30 | 191.41 | 192.53 | 193.65 | 194.76 | 195.88 |
| Woodie | 174.28 | 180.86 | 186.45 | 193.03 | 198.62 | 205.20 | 210.79 |
| Fibonacci | 181.03 | 185.68 | 188.55 | 193.20 | 197.85 | 200.72 | 205.37 |
Numerical data
The following is the status of technical indicators and moving averages registered at the time this technical analysis was created:
| RSI (14): | 71.00 | |
| MACD (12,26,9): | 2.1400 | |
| Directional Movement: | 27.59 | |
| AROON (14): | 71.43 | |
| DEMA (21): | 195.47 | |
| Parabolic SAR (0,02-0,02-0,2): | 193.59 | |
| Elder Ray (13): | 1.33 | |
| Super Trend (3,10): | 192.03 | |
| Zig ZAG (10): | 194.94 | |
| VORTEX (21): | 1.3000 | |
| Stochastique (14,3,5): | 84.13 | |
| TEMA (21): | 196.10 | |
| Williams %R (14): | -15.57 | |
| Chande Momentum Oscillator (20): | 3.46 | |
| Repulse (5,40,3): | 0.2100 | |
| ROCnROLL: | 1 | |
| TRIX (15,9): | 0.1800 | |
| Courbe Coppock: | 4.16 |
| MA7: | 188.75 | |
| MA20: | 188.13 | |
| MA50: | 190.28 | |
| MA100: | 183.33 | |
| MAexp7: | 194.54 | |
| MAexp20: | 192.58 | |
| MAexp50: | 189.48 | |
| MAexp100: | 188.40 | |
| Price / MA7: | +3.40% | |
| Price / MA20: | +3.74% | |
| Price / MA50: | +2.56% | |
| Price / MA100: | +6.45% | |
| Price / MAexp7: | +0.32% | |
| Price / MAexp20: | +1.34% | |
| Price / MAexp50: | +3.00% | |
| Price / MAexp100: | +3.59% |
News
The latest news and videos published on APPLE INC. at the time of the analysis were as follows:
-
 Apple $32 Fined Million For Infringing Qualcomm Patents
-
Apple Infringed Three Qualcomm Patents
- Qualcomm Wins Patent Infringement Case Against Apple in San Diego
-
Apple Is Holding A Big Event This Month
-
Spotify Vs Apple
About author

Online


Add a comment
Comments
0 comments on the analysis APPLE INC. - 1H