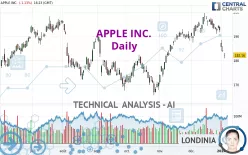
APPLE INC. - Daily - Technical analysis published on 01/04/2024 (GMT)
- 173
- 0
Click here for a new analysis!
- Timeframe : Daily
- - Analysis generated on
- Status : INVALID

Summary of the analysis

Additional analysis
Quotes
APPLE INC. rating 182.15 USD. On the day, this instrument lost -1.14% and was traded between 180.88 USD and 183.09 USD over the period. The price is currently at +0.70% from its lowest and -0.51% from its highest.The Central Gaps scanner detects a bearish gap which is a sign that the sellers have taken the lead in the very short term.
Opening Gap DOWN
Type : Bearish
Timeframe : Openning
Here is a more detailed summary of the historical variations registered by APPLE INC.:
Near a new HIGH record (1st january)
Type : Bullish
Timeframe : Weekly
New LOW record (1st january)
Type : Bearish
Timeframe : Weekly
New LOW record (1 month)
Type : Bearish
Timeframe : Weekly
Technical
A technical analysis in Daily of this APPLE INC. chart shows a slightly bearish trend. 53.57% of the signals given by moving averages are bearish. The overall trend could accelerate as a result of the strong bearish signals from short-term moving averages. The Central Indicators scanner detects a bearish signal on moving averages that could impact this trend:
Bearish trend reversal : adaptative moving average 100
Type : Bearish
Timeframe : Daily
An assessment of technical indicators shows a bearish signal.
But beware of excesses. The Central Indicators scanner currently detects this:
RSI indicator is oversold : under 30
Type : Neutral
Timeframe : Daily
CCI indicator is oversold : under -100
Type : Neutral
Timeframe : Daily
Previous candle closed under Bollinger bands
Type : Neutral
Timeframe : Daily
Williams %R indicator is oversold : under -80
Type : Neutral
Timeframe : Daily
Pivot points : price is under support 1
Type : Neutral
Timeframe : Daily
Pivot points : price is under support 3
Type : Neutral
Timeframe : Weekly
MACD indicator is back under 0
Type : Bearish
Timeframe : Daily
The Central Patterns scanner, which studies chart patterns, resistances and supports, has identified these signals:
Near horizontal support
Type : Bullish
Timeframe : Daily
Support of channel is broken
Type : Bearish
Timeframe : Daily
The Central Candlesticks scanner, specialised in Japanese candlesticks, did not identify any signals.
| S3 | S2 | S1 | Price | R1 | R2 | |
|---|---|---|---|---|---|---|
| ProTrendLines | 166.70 | 173.81 | 179.95 | 182.15 | 189.41 | 195.93 |
| Change (%) | -8.48% | -4.58% | -1.21% | - | +3.99% | +7.57% |
| Change | -15.45 | -8.34 | -2.20 | - | +7.26 | +13.78 |
| Level | Intermediate | Minor | Major | - | Minor | Major |
To determine price objectives, it is also possible to use the pivot points. Here is the price position in relation to pivot points:
| Pivot points | S3 | S2 | S1 | PP | R1 | R2 | R3 |
|---|---|---|---|---|---|---|---|
| Standard | 180.71 | 182.07 | 183.16 | 184.52 | 185.61 | 186.97 | 188.06 |
| Camarilla | 183.58 | 183.80 | 184.03 | 184.25 | 184.48 | 184.70 | 184.92 |
| Woodie | 180.58 | 182.00 | 183.03 | 184.45 | 185.48 | 186.90 | 187.93 |
| Fibonacci | 182.07 | 183.01 | 183.58 | 184.52 | 185.46 | 186.03 | 186.97 |
| Pivot points | S3 | S2 | S1 | PP | R1 | R2 | R3 |
|---|---|---|---|---|---|---|---|
| Standard | 187.29 | 189.19 | 190.86 | 192.76 | 194.43 | 196.33 | 198.00 |
| Camarilla | 191.55 | 191.88 | 192.20 | 192.53 | 192.86 | 193.19 | 193.51 |
| Woodie | 187.18 | 189.13 | 190.75 | 192.70 | 194.32 | 196.27 | 197.89 |
| Fibonacci | 189.19 | 190.55 | 191.40 | 192.76 | 194.12 | 194.97 | 196.33 |
| Pivot points | S3 | S2 | S1 | PP | R1 | R2 | R3 |
|---|---|---|---|---|---|---|---|
| Standard | 174.61 | 181.03 | 186.78 | 193.20 | 198.95 | 205.37 | 211.12 |
| Camarilla | 189.18 | 190.30 | 191.41 | 192.53 | 193.65 | 194.76 | 195.88 |
| Woodie | 174.28 | 180.86 | 186.45 | 193.03 | 198.62 | 205.20 | 210.79 |
| Fibonacci | 181.03 | 185.68 | 188.55 | 193.20 | 197.85 | 200.72 | 205.37 |
Numerical data
The following are the details of the technical indicators and moving averages that were collected to generate this technical analysis:
| RSI (14): | 30.22 | |
| MACD (12,26,9): | -0.6600 | |
| Directional Movement: | -23.95 | |
| AROON (14): | -92.86 | |
| DEMA (21): | 191.02 | |
| Parabolic SAR (0,02-0,02-0,2): | 194.32 | |
| Elder Ray (13): | -8.20 | |
| Super Trend (3,10): | 191.20 | |
| Zig ZAG (10): | 182.33 | |
| VORTEX (21): | 0.8600 | |
| Stochastique (14,3,5): | 7.84 | |
| TEMA (21): | 187.91 | |
| Williams %R (14): | -92.83 | |
| Chande Momentum Oscillator (20): | -15.35 | |
| Repulse (5,40,3): | -0.7900 | |
| ROCnROLL: | 2 | |
| TRIX (15,9): | 0.1100 | |
| Courbe Coppock: | 6.66 |
| MA7: | 189.19 | |
| MA20: | 193.21 | |
| MA50: | 187.19 | |
| MA100: | 182.21 | |
| MAexp7: | 187.89 | |
| MAexp20: | 190.82 | |
| MAexp50: | 188.33 | |
| MAexp100: | 184.27 | |
| Price / MA7: | -3.72% | |
| Price / MA20: | -5.72% | |
| Price / MA50: | -2.69% | |
| Price / MA100: | -0.03% | |
| Price / MAexp7: | -3.05% | |
| Price / MAexp20: | -4.54% | |
| Price / MAexp50: | -3.28% | |
| Price / MAexp100: | -1.15% |
News
Don't forget to follow the news on APPLE INC.. At the time of publication of this analysis, the latest news was as follows:
-
 Apple $32 Fined Million For Infringing Qualcomm Patents
-
Apple Infringed Three Qualcomm Patents
- Qualcomm Wins Patent Infringement Case Against Apple in San Diego
-
Apple Is Holding A Big Event This Month
-
Spotify Vs Apple
About author

Online


Add a comment
Comments
0 comments on the analysis APPLE INC. - Daily