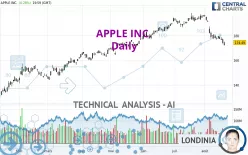
APPLE INC. - Daily - Technical analysis published on 08/20/2023 (GMT)
- 204
- 0
Click here for a new analysis!
- Timeframe : Daily
- - Analysis generated on
- Status : INVALID

Summary of the analysis

Additional analysis
Quotes
The APPLE INC. price is 174.49 USD. The price registered an increase of +0.28% on the session and was traded between 171.96 USD and 175.10 USD over the period. The price is currently at +1.47% from its lowest and -0.35% from its highest.The Central Gaps scanner detects a bearish gap which is a sign that the sellers have taken the lead in the very short term.
Opening Gap DOWN
Type : Bearish
Timeframe : Openning
Here is a more detailed summary of the historical variations registered by APPLE INC.:
New LOW record (1 month)
Type : Bearish
Timeframe : Weekly
Technical
Technical analysis of APPLE INC. in Daily shows an overall bearish trend. 67.86% of the signals given by moving averages are bearish. This bearish trend is supported by the strong bearish signals given by short-term moving averages. The Central Indicators scanner does not detect any result on moving averages that would impact this trend.
The probability of a further decline is moderate given the direction of the technical indicators.
But beware of excesses. The Central Indicators scanner currently detects this:
RSI indicator is oversold : under 30
Type : Neutral
Timeframe : Daily
RSI indicator: bullish divergence
Type : Bullish
Timeframe : Daily
Williams %R indicator is oversold : under -80
Type : Neutral
Timeframe : Daily
Pivot points : price is under support 1
Type : Neutral
Timeframe : Weekly
An analysis of the price chart with the Central Patterns scanner (detector of chart patterns and resistances and supports) shows a result that can have an impact on the price change:
Near support of channel
Type : Bullish
Timeframe : Daily
The Central Candlesticks scanner which studies Japanese candlesticks did not detect anything.
| S3 | S2 | S1 | Price | R1 | R2 | |
|---|---|---|---|---|---|---|
| ProTrendLines | 134.49 | 144.97 | 171.43 | 174.49 | 180.19 | 196.19 |
| Change (%) | -22.92% | -16.92% | -1.75% | - | +3.27% | +12.44% |
| Change | -40.00 | -29.52 | -3.06 | - | +5.70 | +21.70 |
| Level | Minor | Intermediate | Major | - | Major | Major |
Attention could also be paid to pivot points to set price objectives:
| Pivot points | S3 | S2 | S1 | PP | R1 | R2 | R3 |
|---|---|---|---|---|---|---|---|
| Standard | 169.46 | 170.71 | 172.60 | 173.85 | 175.74 | 176.99 | 178.88 |
| Camarilla | 173.63 | 173.91 | 174.20 | 174.49 | 174.78 | 175.07 | 175.35 |
| Woodie | 169.78 | 170.87 | 172.92 | 174.01 | 176.06 | 177.15 | 179.20 |
| Fibonacci | 170.71 | 171.91 | 172.65 | 173.85 | 175.05 | 175.79 | 176.99 |
| Pivot points | S3 | S2 | S1 | PP | R1 | R2 | R3 |
|---|---|---|---|---|---|---|---|
| Standard | 163.34 | 167.65 | 171.07 | 175.38 | 178.80 | 183.11 | 186.53 |
| Camarilla | 172.36 | 173.07 | 173.78 | 174.49 | 175.20 | 175.91 | 176.62 |
| Woodie | 162.90 | 167.43 | 170.63 | 175.16 | 178.36 | 182.89 | 186.09 |
| Fibonacci | 167.65 | 170.60 | 172.43 | 175.38 | 178.33 | 180.16 | 183.11 |
| Pivot points | S3 | S2 | S1 | PP | R1 | R2 | R3 |
|---|---|---|---|---|---|---|---|
| Standard | 177.43 | 181.89 | 189.04 | 193.50 | 200.65 | 205.11 | 212.26 |
| Camarilla | 193.00 | 194.06 | 195.13 | 196.19 | 197.25 | 198.32 | 199.38 |
| Woodie | 178.78 | 182.56 | 190.39 | 194.17 | 202.00 | 205.78 | 213.61 |
| Fibonacci | 181.89 | 186.33 | 189.07 | 193.50 | 197.94 | 200.68 | 205.11 |
Numerical data
The following is the status of technical indicators and moving averages registered at the time this technical analysis was created:
| RSI (14): | 29.08 | |
| MACD (12,26,9): | -3.8400 | |
| Directional Movement: | -23.22 | |
| AROON (14): | -92.86 | |
| DEMA (21): | 177.97 | |
| Parabolic SAR (0,02-0,02-0,2): | 182.87 | |
| Elder Ray (13): | -6.31 | |
| Super Trend (3,10): | 183.06 | |
| Zig ZAG (10): | 174.49 | |
| VORTEX (21): | 0.7200 | |
| Stochastique (14,3,5): | 4.31 | |
| TEMA (21): | 173.67 | |
| Williams %R (14): | -89.67 | |
| Chande Momentum Oscillator (20): | -17.83 | |
| Repulse (5,40,3): | -0.7900 | |
| ROCnROLL: | 2 | |
| TRIX (15,9): | -0.1900 | |
| Courbe Coppock: | 17.78 |
| MA7: | 176.78 | |
| MA20: | 184.94 | |
| MA50: | 186.91 | |
| MA100: | 178.03 | |
| MAexp7: | 176.95 | |
| MAexp20: | 182.15 | |
| MAexp50: | 183.26 | |
| MAexp100: | 177.59 | |
| Price / MA7: | -1.30% | |
| Price / MA20: | -5.65% | |
| Price / MA50: | -6.64% | |
| Price / MA100: | -1.99% | |
| Price / MAexp7: | -1.39% | |
| Price / MAexp20: | -4.21% | |
| Price / MAexp50: | -4.79% | |
| Price / MAexp100: | -1.75% |
News
Don't forget to follow the news on APPLE INC.. At the time of publication of this analysis, the latest news was as follows:
-
 Apple $32 Fined Million For Infringing Qualcomm Patents
-
Apple Infringed Three Qualcomm Patents
- Qualcomm Wins Patent Infringement Case Against Apple in San Diego
-
Apple Is Holding A Big Event This Month
-
Spotify Vs Apple
About author

Online


Add a comment
Comments
0 comments on the analysis APPLE INC. - Daily