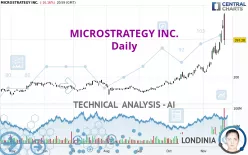
MICROSTRATEGY INC. - Daily - Technical analysis published on 11/22/2024 (GMT)
- 120
- 0
Click here for a new analysis!
- Timeframe : Daily
- - Analysis generated on
- Status : INVALID

Summary of the analysis

Additional analysis
Quotes
MICROSTRATEGY INC. rating 397.28 USD. On the day, this instrument lost -16.16% and was between 371.84 USD and 543.00 USD. This implies that the price is at +6.84% from its lowest and at -26.84% from its highest.The Central Gaps scanner detects a bullish gap which is a sign that buyers have taken the lead in the very short term.
Opening Gap UP
Type : Bullish
Timeframe : Openning
So that you have an overall view of the price change, here is a table showing the variations over several periods:
New HIGH record (5 years)
Type : Bullish
Timeframe : Weekly
New HIGH record (1 year)
Type : Bullish
Timeframe : Weekly
New HIGH record (1st january)
Type : Bullish
Timeframe : Weekly
New HIGH record (1 month)
Type : Bullish
Timeframe : Weekly
Abnormal volumes on MICROSTRATEGY INC. were detected by the Central Volumes scanner:
Abnormal volumes
Timeframe : 5 days
Abnormal volumes
Timeframe : 20 days
Technical
A technical analysis in Daily of this MICROSTRATEGY INC. chart shows a strongly bullish trend. The signals given by the moving averages are 92.86% bullish. This strong bullish trend is confirmed by the strong signals currently being given by short-term moving averages. There is no crossing of moving average by the price or crossing of moving averages between themselves.
In fact, 13 technical indicators on 18 studied are currently positioned bullish. But beware of excesses. The Central Indicators scanner currently detects this:
CCI indicator is overbought : over 100
Type : Neutral
Timeframe : Daily
Previous candle closed over Bollinger bands
Type : Neutral
Timeframe : Daily
CCI indicator: bearish divergence
Type : Bearish
Timeframe : Daily
RSI indicator: bearish divergence
Type : Bearish
Timeframe : Daily
Pivot points : price is over resistance 1
Type : Neutral
Timeframe : Weekly
Pivot points : price is under support 3
Type : Neutral
Timeframe : Daily
Parabolic SAR indicator bearish reversal
Type : Bearish
Timeframe : Daily
Central Patterns, the scanner specializing in chart patterns, did not identify any signals.
The presence of these bearish patterns in Japanese candlesticks detected by Central Candlesticks that could cause a correction in the very short term were also noted
Long black line
Type : Bearish
Timeframe : Daily
Bearish engulfing lines
Type : Bearish
Timeframe : Daily
| S3 | S2 | S1 | Price | |
|---|---|---|---|---|
| ProTrendLines | 191.92 | 327.67 | 356.59 | 397.28 |
| Change (%) | -51.69% | -17.52% | -10.24% | - |
| Change | -205.36 | -69.61 | -40.69 | - |
| Level | Major | Intermediate | Major | - |
Pivot points can also be used to set your price objectives. Here is the price situation in relation to pivot points:
| Pivot points | S3 | S2 | S1 | PP | R1 | R2 | R3 |
|---|---|---|---|---|---|---|---|
| Standard | 160.59 | 266.21 | 331.75 | 437.37 | 502.91 | 608.53 | 674.07 |
| Camarilla | 350.21 | 365.90 | 381.59 | 397.28 | 412.97 | 428.66 | 444.35 |
| Woodie | 140.54 | 256.19 | 311.70 | 427.35 | 482.86 | 598.51 | 654.02 |
| Fibonacci | 266.21 | 331.60 | 371.99 | 437.37 | 502.76 | 543.15 | 608.53 |
| Pivot points | S3 | S2 | S1 | PP | R1 | R2 | R3 |
|---|---|---|---|---|---|---|---|
| Standard | 204.73 | 249.02 | 294.83 | 339.12 | 384.93 | 429.22 | 475.03 |
| Camarilla | 315.87 | 324.13 | 332.39 | 340.65 | 348.91 | 357.17 | 365.43 |
| Woodie | 205.50 | 249.40 | 295.60 | 339.50 | 385.70 | 429.60 | 475.80 |
| Fibonacci | 249.02 | 283.44 | 304.70 | 339.12 | 373.54 | 394.80 | 429.22 |
| Pivot points | S3 | S2 | S1 | PP | R1 | R2 | R3 |
|---|---|---|---|---|---|---|---|
| Standard | 67.51 | 112.27 | 178.38 | 223.14 | 289.25 | 334.01 | 400.12 |
| Camarilla | 214.01 | 224.17 | 234.34 | 244.50 | 254.66 | 264.83 | 274.99 |
| Woodie | 78.20 | 117.61 | 189.07 | 228.48 | 299.94 | 339.35 | 410.81 |
| Fibonacci | 112.27 | 154.62 | 180.78 | 223.14 | 265.49 | 291.65 | 334.01 |
Numerical data
The following is the status of the technical indicators and moving averages at the time of publication of this technical analysis:
| RSI (14): | 65.69 | |
| MACD (12,26,9): | 55.6200 | |
| Directional Movement: | 22.56 | |
| AROON (14): | 92.86 | |
| DEMA (21): | 389.99 | |
| Parabolic SAR (0,02-0,02-0,2): | 504.83 | |
| Elder Ray (13): | 104.34 | |
| Super Trend (3,10): | 363.01 | |
| Zig ZAG (10): | 397.28 | |
| VORTEX (21): | 1.1000 | |
| Stochastique (14,3,5): | 78.59 | |
| TEMA (21): | 418.97 | |
| Williams %R (14): | -45.23 | |
| Chande Momentum Oscillator (20): | 169.48 | |
| Repulse (5,40,3): | -35.3300 | |
| ROCnROLL: | 1 | |
| TRIX (15,9): | 2.6400 | |
| Courbe Coppock: | 124.72 |
| MA7: | 383.31 | |
| MA20: | 304.95 | |
| MA50: | 228.27 | |
| MA100: | 184.98 | |
| MAexp7: | 389.67 | |
| MAexp20: | 322.54 | |
| MAexp50: | 253.49 | |
| MAexp100: | 207.43 | |
| Price / MA7: | +3.64% | |
| Price / MA20: | +30.28% | |
| Price / MA50: | +74.04% | |
| Price / MA100: | +114.77% | |
| Price / MAexp7: | +1.95% | |
| Price / MAexp20: | +23.17% | |
| Price / MAexp50: | +56.72% | |
| Price / MAexp100: | +91.52% |
News
The latest news and videos published on MICROSTRATEGY INC. at the time of the analysis were as follows:
- MicroStrategy Completes $3,000,000,000 Offering of 0% Convertible Senior Notes Due 2029
- MicroStrategy Announces Pricing of Offering of 0% Convertible Senior Notes
- MicroStrategy Announces Proposed Private Offering of $1.75 Billion of Convertible Senior Notes
- MicroStrategy Announces BTC and ATM Activity; Raised $2.03 billion; Purchased 27,200 BTC; Now Holds 279,420 BTC with BTC Yield of 26.4% YTD
- Vortex Brands Co. Acquires MicroStrategy Stock as Strategic Asset
About author

Online


Add a comment
Comments
0 comments on the analysis MICROSTRATEGY INC. - Daily