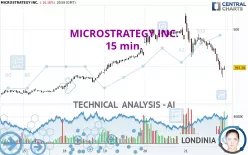
MICROSTRATEGY INC. - 15 min. - Technical analysis published on 11/22/2024 (GMT)
- 103
- 0
Click here for a new analysis!
- Timeframe : 15 min.
- - Analysis generated on
- Status : INVALID

Summary of the analysis

Additional analysis
Quotes
MICROSTRATEGY INC. rating 397.28 USD. The price is lower by -16.16% since the last closing with the lowest point at 371.84 USD and the highest point at 543.00 USD. The deviation from the price is +6.84% for the low point and -26.84% for the high point.The Central Gaps scanner detects a bullish gap which is a sign that buyers have taken the lead in the very short term.
Opening Gap UP
Type : Bullish
Timeframe : Openning
A study of price movements over other periods shows the following variations:
New HIGH record (5 years)
Type : Bullish
Timeframe : Weekly
New HIGH record (1 year)
Type : Bullish
Timeframe : Weekly
New HIGH record (1st january)
Type : Bullish
Timeframe : Weekly
New HIGH record (1 month)
Type : Bullish
Timeframe : Weekly
The Central Volumes scanner notes the presence of abnormal volumes:
Abnormal volumes
Timeframe : 5 days
Abnormal volumes
Timeframe : 20 days
Technical
A technical analysis in 15 min. of this MICROSTRATEGY INC. chart shows a bearish trend. 67.86% of the signals given by moving averages are bearish. The overall trend is reinforced by the strong bearish signals from short-term moving averages. There is no crossing of moving average by the price or crossing of moving averages between themselves.
An assessment of technical indicators does not currently provide any relevant information to suggest whether the signal given by the technical indicators is more bullish or bearish.
But beware of excesses. The Central Indicators scanner currently detects this:
CCI indicator is oversold : under -100
Type : Neutral
Timeframe : 15 minutes
Pivot points : price is over resistance 1
Type : Neutral
Timeframe : Weekly
Pivot points : price is under support 3
Type : Neutral
Timeframe : 15 minutes
The Central Patterns scanner, which studies chart patterns, resistances and supports, has identified this signal:
Near horizontal support
Type : Bullish
Timeframe : 15 minutes
No result was found by the Central Candlesticks scanner on Japanese candlesticks.
| S3 | S2 | S1 | Price | R1 | R2 | R3 | |
|---|---|---|---|---|---|---|---|
| ProTrendLines | 327.67 | 356.59 | 383.40 | 397.28 | 425.78 | 499.35 | 543.00 |
| Change (%) | -17.52% | -10.24% | -3.49% | - | +7.17% | +25.69% | +36.68% |
| Change | -69.61 | -40.69 | -13.88 | - | +28.50 | +102.07 | +145.72 |
| Level | Intermediate | Major | Intermediate | - | Minor | Minor | Major |
Pivot points can also be used to set your price objectives. Here is the price situation in relation to pivot points:
| Pivot points | S3 | S2 | S1 | PP | R1 | R2 | R3 |
|---|---|---|---|---|---|---|---|
| Standard | 160.59 | 266.21 | 331.75 | 437.37 | 502.91 | 608.53 | 674.07 |
| Camarilla | 350.21 | 365.90 | 381.59 | 397.28 | 412.97 | 428.66 | 444.35 |
| Woodie | 140.54 | 256.19 | 311.70 | 427.35 | 482.86 | 598.51 | 654.02 |
| Fibonacci | 266.21 | 331.60 | 371.99 | 437.37 | 502.76 | 543.15 | 608.53 |
| Pivot points | S3 | S2 | S1 | PP | R1 | R2 | R3 |
|---|---|---|---|---|---|---|---|
| Standard | 204.73 | 249.02 | 294.83 | 339.12 | 384.93 | 429.22 | 475.03 |
| Camarilla | 315.87 | 324.13 | 332.39 | 340.65 | 348.91 | 357.17 | 365.43 |
| Woodie | 205.50 | 249.40 | 295.60 | 339.50 | 385.70 | 429.60 | 475.80 |
| Fibonacci | 249.02 | 283.44 | 304.70 | 339.12 | 373.54 | 394.80 | 429.22 |
| Pivot points | S3 | S2 | S1 | PP | R1 | R2 | R3 |
|---|---|---|---|---|---|---|---|
| Standard | 67.51 | 112.27 | 178.38 | 223.14 | 289.25 | 334.01 | 400.12 |
| Camarilla | 214.01 | 224.17 | 234.34 | 244.50 | 254.66 | 264.83 | 274.99 |
| Woodie | 78.20 | 117.61 | 189.07 | 228.48 | 299.94 | 339.35 | 410.81 |
| Fibonacci | 112.27 | 154.62 | 180.78 | 223.14 | 265.49 | 291.65 | 334.01 |
Numerical data
The following are the details of the technical indicators and moving averages that were collected to generate this technical analysis:
| RSI (14): | 31.37 | |
| MACD (12,26,9): | -20.5400 | |
| Directional Movement: | -29.08 | |
| AROON (14): | -92.86 | |
| DEMA (21): | 412.31 | |
| Parabolic SAR (0,02-0,02-0,2): | 437.01 | |
| Elder Ray (13): | -36.76 | |
| Super Trend (3,10): | 444.28 | |
| Zig ZAG (10): | 397.28 | |
| VORTEX (21): | 0.8500 | |
| Stochastique (14,3,5): | 12.68 | |
| TEMA (21): | 394.52 | |
| Williams %R (14): | -75.58 | |
| Chande Momentum Oscillator (20): | -63.99 | |
| Repulse (5,40,3): | -1.1800 | |
| ROCnROLL: | 2 | |
| TRIX (15,9): | -0.4300 | |
| Courbe Coppock: | 25.33 |
| MA7: | 383.31 | |
| MA20: | 304.95 | |
| MA50: | 228.27 | |
| MA100: | 184.98 | |
| MAexp7: | 408.29 | |
| MAexp20: | 435.75 | |
| MAexp50: | 448.67 | |
| MAexp100: | 432.61 | |
| Price / MA7: | +3.64% | |
| Price / MA20: | +30.28% | |
| Price / MA50: | +74.04% | |
| Price / MA100: | +114.77% | |
| Price / MAexp7: | -2.70% | |
| Price / MAexp20: | -8.83% | |
| Price / MAexp50: | -11.45% | |
| Price / MAexp100: | -8.17% |
News
The latest news and videos published on MICROSTRATEGY INC. at the time of the analysis were as follows:
- MicroStrategy Completes $3,000,000,000 Offering of 0% Convertible Senior Notes Due 2029
- MicroStrategy Announces Pricing of Offering of 0% Convertible Senior Notes
- MicroStrategy Announces Proposed Private Offering of $1.75 Billion of Convertible Senior Notes
- MicroStrategy Announces BTC and ATM Activity; Raised $2.03 billion; Purchased 27,200 BTC; Now Holds 279,420 BTC with BTC Yield of 26.4% YTD
- Vortex Brands Co. Acquires MicroStrategy Stock as Strategic Asset
About author

Online


Add a comment
Comments
0 comments on the analysis MICROSTRATEGY INC. - 15 min.