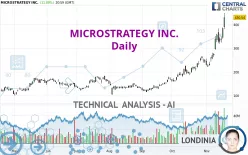
MICROSTRATEGY INC. - Daily - Technical analysis published on 11/20/2024 (GMT)
- 138
- 0
- Timeframe : Daily
- - Analysis generated on
- Status : WITHOUT TARGET

Summary of the analysis

Additional analysis
Quotes
The MICROSTRATEGY INC. price is 430.54 USD. The price registered an increase of +11.89% on the session and was traded between 381.00 USD and 449.00 USD over the period. The price is currently at +13.00% from its lowest and -4.11% from its highest.The Central Gaps scanner detects a bullish gap which is a sign that buyers have taken the lead in the very short term.
Opening Gap UP
Type : Bullish
Timeframe : Openning
A study of price movements over other periods shows the following variations:
New HIGH record (5 years)
Type : Bullish
Timeframe : Weekly
New HIGH record (1 year)
Type : Bullish
Timeframe : Weekly
New HIGH record (1st january)
Type : Bullish
Timeframe : Weekly
New HIGH record (1 month)
Type : Bullish
Timeframe : Weekly
The Central Volumes scanner notes the presence of abnormal volumes:
Abnormal volumes
Timeframe : 5 days
Technical
Technical analysis of MICROSTRATEGY INC. in Daily shows a strongly overall bullish trend. The signals given by the moving averages are 92.86% bullish. This strong bullish trend is confirmed by the strong signals currently being given by short-term moving averages. There is no crossing of moving average by the price or crossing of moving averages between themselves.
The probability of a further increase is high given the direction of the technical indicators.
Caution: the Central Indicators scanner currently detects an excess:
RSI indicator is overbought : over 80
Type : Neutral
Timeframe : Daily
CCI indicator is overbought : over 100
Type : Neutral
Timeframe : Daily
Williams %R indicator is overbought : over -20
Type : Neutral
Timeframe : Daily
Pivot points : price is over resistance 2
Type : Neutral
Timeframe : Weekly
No signals are given by Central Patterns, a market scanner specialised in chart patterns, resistances and supports.
No result was found by the Central Candlesticks scanner on Japanese candlesticks.
| S3 | S2 | S1 | Price | |
|---|---|---|---|---|
| ProTrendLines | 191.92 | 222.99 | 356.59 | 430.54 |
| Change (%) | -55.42% | -48.21% | -17.18% | - |
| Change | -238.62 | -207.55 | -73.95 | - |
| Level | Major | Intermediate | Major | - |
Pivot points can also be used to set your price objectives. Here is the price situation in relation to pivot points:
| Pivot points | S3 | S2 | S1 | PP | R1 | R2 | R3 |
|---|---|---|---|---|---|---|---|
| Standard | 323.36 | 352.18 | 391.36 | 420.18 | 459.36 | 488.18 | 527.36 |
| Camarilla | 411.84 | 418.07 | 424.31 | 430.54 | 436.77 | 443.01 | 449.24 |
| Woodie | 328.54 | 354.77 | 396.54 | 422.77 | 464.54 | 490.77 | 532.54 |
| Fibonacci | 352.18 | 378.16 | 394.20 | 420.18 | 446.16 | 462.20 | 488.18 |
| Pivot points | S3 | S2 | S1 | PP | R1 | R2 | R3 |
|---|---|---|---|---|---|---|---|
| Standard | 204.73 | 249.02 | 294.83 | 339.12 | 384.93 | 429.22 | 475.03 |
| Camarilla | 315.87 | 324.13 | 332.39 | 340.65 | 348.91 | 357.17 | 365.43 |
| Woodie | 205.50 | 249.40 | 295.60 | 339.50 | 385.70 | 429.60 | 475.80 |
| Fibonacci | 249.02 | 283.44 | 304.70 | 339.12 | 373.54 | 394.80 | 429.22 |
| Pivot points | S3 | S2 | S1 | PP | R1 | R2 | R3 |
|---|---|---|---|---|---|---|---|
| Standard | 67.51 | 112.27 | 178.38 | 223.14 | 289.25 | 334.01 | 400.12 |
| Camarilla | 214.01 | 224.17 | 234.34 | 244.50 | 254.66 | 264.83 | 274.99 |
| Woodie | 78.20 | 117.61 | 189.07 | 228.48 | 299.94 | 339.35 | 410.81 |
| Fibonacci | 112.27 | 154.62 | 180.78 | 223.14 | 265.49 | 291.65 | 334.01 |
Numerical data
The following are the details of the technical indicators and moving averages that were collected to generate this technical analysis:
| RSI (14): | 82.47 | |
| MACD (12,26,9): | 48.1200 | |
| Directional Movement: | 45.78 | |
| AROON (14): | 78.57 | |
| DEMA (21): | 355.91 | |
| Parabolic SAR (0,02-0,02-0,2): | 324.10 | |
| Elder Ray (13): | 90.64 | |
| Super Trend (3,10): | 308.59 | |
| Zig ZAG (10): | 430.54 | |
| VORTEX (21): | 1.1800 | |
| Stochastique (14,3,5): | 87.80 | |
| TEMA (21): | 380.94 | |
| Williams %R (14): | -8.09 | |
| Chande Momentum Oscillator (20): | 200.83 | |
| Repulse (5,40,3): | 19.0100 | |
| ROCnROLL: | 1 | |
| TRIX (15,9): | 2.3000 | |
| Courbe Coppock: | 98.30 |
| MA7: | 358.37 | |
| MA20: | 283.89 | |
| MA50: | 216.04 | |
| MA100: | 178.96 | |
| MAexp7: | 358.24 | |
| MAexp20: | 297.92 | |
| MAexp50: | 238.39 | |
| MAexp100: | 198.16 | |
| Price / MA7: | +20.14% | |
| Price / MA20: | +51.66% | |
| Price / MA50: | +99.29% | |
| Price / MA100: | +140.58% | |
| Price / MAexp7: | +20.18% | |
| Price / MAexp20: | +44.52% | |
| Price / MAexp50: | +80.60% | |
| Price / MAexp100: | +117.27% |
News
Don't forget to follow the news on MICROSTRATEGY INC.. At the time of publication of this analysis, the latest news was as follows:
- MicroStrategy Announces Proposed Private Offering of $1.75 Billion of Convertible Senior Notes
- MicroStrategy Announces BTC and ATM Activity; Raised $2.03 billion; Purchased 27,200 BTC; Now Holds 279,420 BTC with BTC Yield of 26.4% YTD
- Vortex Brands Co. Acquires MicroStrategy Stock as Strategic Asset
- Vertosoft Named as Federal Partner of the Year at MicroStrategy World 2024
- MicroStrategy Cloud enables University of Auckland to Revolutionise Data Accessibility
About author

Online


Add a comment
Comments
0 comments on the analysis MICROSTRATEGY INC. - Daily