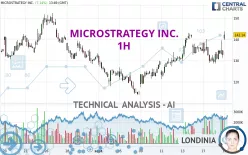
MICROSTRATEGY INC. - 1H - Technical analysis published on 09/19/2024 (GMT)
- 123
- 0
Click here for a new analysis!
- Timeframe : 1H
- - Analysis generated on
- Status : TARGET REACHED

Summary of the analysis

Additional analysis
Quotes
MICROSTRATEGY INC. rating 142.13 USD. The price has increased by +7.13% since the last closing and was between 139.62 USD and 143.72 USD. This implies that the price is at +1.80% from its lowest and at -1.11% from its highest.The Central Gaps scanner detects a bullish gap which is a sign that buyers have taken the lead in the very short term.
Opening Gap UP
Type : Bullish
Timeframe : Openning
So that you have an overall view of the price change, here is a table showing the variations over several periods:
Technical
A technical analysis in 1H of this MICROSTRATEGY INC. chart shows a strongly bullish trend. The signals given by the moving averages are 92.86% bullish. This strong bullish trend is confirmed by the strong signals currently being given by short-term moving averages. An assessment of moving averages reveals several bullish signals that could impact this trend:
Bullish price crossover with Moving Average 20
Type : Bullish
Timeframe : 1 hour
Bullish price crossover with adaptative moving average 20
Type : Bullish
Timeframe : 1 hour
An assessment of technical indicators shows a strong bullish signal.
Caution: the Central Indicators scanner currently detects an excess:
CCI indicator is overbought : over 100
Type : Neutral
Timeframe : 1 hour
Williams %R indicator is overbought : over -20
Type : Neutral
Timeframe : 1 hour
Pivot points : price is over resistance 1
Type : Neutral
Timeframe : 1 hour
RSI indicator is back over 50
Type : Bullish
Timeframe : 1 hour
MACD crosses UP its Moving Average
Type : Bullish
Timeframe : 1 hour
Aroon indicator bullish trend
Type : Bullish
Timeframe : 1 hour
SuperTrend indicator bullish reversal
Type : Bullish
Timeframe : 1 hour
Price is back under the pivot point
Type : Bearish
Timeframe : Weekly
Momentum indicator is back over 0
Type : Bullish
Timeframe : 1 hour
Central Patterns, the market scanner focusing on chart patterns, resistances and supports found this result:
Near support of channel
Type : Bullish
Timeframe : 1 hour
The Central Candlesticks scanner, specialised in Japanese candlesticks, did not identify any signals.
| S3 | S2 | S1 | Price | R1 | R2 | R3 | |
|---|---|---|---|---|---|---|---|
| ProTrendLines | 130.63 | 133.83 | 140.08 | 142.13 | 150.01 | 180.01 | 191.92 |
| Change (%) | -8.09% | -5.84% | -1.44% | - | +5.54% | +26.65% | +35.03% |
| Change | -11.50 | -8.30 | -2.05 | - | +7.88 | +37.88 | +49.79 |
| Level | Intermediate | Minor | Intermediate | - | Intermediate | Intermediate | Major |
To determine price objectives, it is also possible to use the pivot points. Here is the price position in relation to pivot points:
| Pivot points | S3 | S2 | S1 | PP | R1 | R2 | R3 |
|---|---|---|---|---|---|---|---|
| Standard | 116.64 | 122.58 | 127.62 | 133.56 | 138.60 | 144.54 | 149.58 |
| Camarilla | 129.65 | 130.66 | 131.66 | 132.67 | 133.68 | 134.68 | 135.69 |
| Woodie | 116.20 | 122.36 | 127.18 | 133.34 | 138.16 | 144.32 | 149.14 |
| Fibonacci | 122.58 | 126.77 | 129.36 | 133.56 | 137.75 | 140.34 | 144.54 |
| Pivot points | S3 | S2 | S1 | PP | R1 | R2 | R3 |
|---|---|---|---|---|---|---|---|
| Standard | 99.48 | 108.49 | 124.98 | 133.99 | 150.48 | 159.49 | 175.98 |
| Camarilla | 134.46 | 136.80 | 139.13 | 141.47 | 143.81 | 146.15 | 148.48 |
| Woodie | 103.22 | 110.36 | 128.72 | 135.86 | 154.22 | 161.36 | 179.72 |
| Fibonacci | 108.49 | 118.23 | 124.25 | 133.99 | 143.73 | 149.75 | 159.49 |
| Pivot points | S3 | S2 | S1 | PP | R1 | R2 | R3 |
|---|---|---|---|---|---|---|---|
| Standard | 41.03 | 71.71 | 102.07 | 132.75 | 163.11 | 193.79 | 224.15 |
| Camarilla | 115.63 | 121.23 | 126.83 | 132.42 | 138.02 | 143.61 | 149.21 |
| Woodie | 40.86 | 71.63 | 101.90 | 132.67 | 162.94 | 193.71 | 223.98 |
| Fibonacci | 71.71 | 95.03 | 109.44 | 132.75 | 156.07 | 170.48 | 193.79 |
Numerical data
The following is the status of the technical indicators and moving averages at the time of publication of this technical analysis:
| RSI (14): | 64.48 | |
| MACD (12,26,9): | 0.7500 | |
| Directional Movement: | 21.65 | |
| AROON (14): | 42.86 | |
| DEMA (21): | 135.08 | |
| Parabolic SAR (0,02-0,02-0,2): | 128.94 | |
| Elder Ray (13): | 6.72 | |
| Super Trend (3,10): | 128.25 | |
| Zig ZAG (10): | 142.99 | |
| VORTEX (21): | 1.0000 | |
| Stochastique (14,3,5): | 62.42 | |
| TEMA (21): | 134.83 | |
| Williams %R (14): | -2.64 | |
| Chande Momentum Oscillator (20): | 6.75 | |
| Repulse (5,40,3): | 1.5000 | |
| ROCnROLL: | 1 | |
| TRIX (15,9): | 0.0300 | |
| Courbe Coppock: | 0.64 |
| MA7: | 134.75 | |
| MA20: | 132.27 | |
| MA50: | 142.38 | |
| MA100: | 143.10 | |
| MAexp7: | 135.64 | |
| MAexp20: | 134.06 | |
| MAexp50: | 132.34 | |
| MAexp100: | 131.75 | |
| Price / MA7: | +5.48% | |
| Price / MA20: | +7.45% | |
| Price / MA50: | -0.18% | |
| Price / MA100: | -0.68% | |
| Price / MAexp7: | +4.78% | |
| Price / MAexp20: | +6.02% | |
| Price / MAexp50: | +7.40% | |
| Price / MAexp100: | +7.88% |
News
The last news published on MICROSTRATEGY INC. at the time of the generation of this analysis was as follows:
- Vortex Brands Co. Acquires MicroStrategy Stock as Strategic Asset
- Vertosoft Named as Federal Partner of the Year at MicroStrategy World 2024
- MicroStrategy Cloud enables University of Auckland to Revolutionise Data Accessibility
- Thinking about trading options or stock in NVIDIA, Mongodb, MicroStrategy, Carnival, or AT&T?
- Vertosoft Named as New Distributor for MicroStrategy
About author
Online


Add a comment
Comments
0 comments on the analysis MICROSTRATEGY INC. - 1H