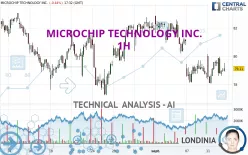
MICROCHIP TECHNOLOGY INC. - 1H - Technical analysis published on 09/12/2023 (GMT)
- 213
- 0
Click here for a new analysis!
- Timeframe : 1H
- - Analysis generated on
- Status : TARGET REACHED

Summary of the analysis

Additional analysis
Quotes
The MICROCHIP TECHNOLOGY INC. price is 79.43 USD. On the day, this instrument lost -0.04% and was traded between 78.57 USD and 79.95 USD over the period. The price is currently at +1.09% from its lowest and -0.65% from its highest.The Central Gaps scanner detects a bearish opening. A small advantage for sellers in the very short term.
Bearish opening
Type : Bearish
Timeframe : Openning
Here is a more detailed summary of the historical variations registered by MICROCHIP TECHNOLOGY INC.:
Near a new LOW record (1 month)
Type : Bearish
Timeframe : Weekly
Technical
A technical analysis in 1H of this MICROCHIP TECHNOLOGY INC. chart shows a bearish trend. 71.43% of the signals given by moving averages are bearish. Caution: the neutral signals currently given by short-term moving averages show us that the global trend is losing momentum. The Central Indicators scanner detects a bullish signal on moving averages that could impact this trend:
Bullish price crossover with Moving Average 20
Type : Bullish
Timeframe : 1 hour
The probability of a further increase are moderate given the direction of the technical indicators.
Other results related to technical indicators were also found by the Central Indicators scanner:
Price is back over the pivot point
Type : Bullish
Timeframe : 1 hour
Price is back under the pivot point
Type : Bearish
Timeframe : Weekly
Williams %R indicator is back over -50
Type : Bullish
Timeframe : 1 hour
The Central Patterns scanner, which studies chart patterns, resistances and supports, has identified these signals:
Near horizontal support
Type : Bullish
Timeframe : 1 hour
Near support of triangle
Type : Bullish
Timeframe : 1 hour
No result was found by the Central Candlesticks scanner on Japanese candlesticks.
| S3 | S2 | S1 | Price | R1 | R2 | R3 | |
|---|---|---|---|---|---|---|---|
| ProTrendLines | 75.49 | 77.20 | 78.71 | 79.43 | 81.57 | 84.90 | 86.61 |
| Change (%) | -4.96% | -2.81% | -0.91% | - | +2.69% | +6.89% | +9.04% |
| Change | -3.94 | -2.23 | -0.72 | - | +2.14 | +5.47 | +7.18 |
| Level | Minor | Major | Major | - | Major | Minor | Major |
To determine price objectives, it is also possible to use the pivot points. Here is the price position in relation to pivot points:
| Pivot points | S3 | S2 | S1 | PP | R1 | R2 | R3 |
|---|---|---|---|---|---|---|---|
| Standard | 76.20 | 77.12 | 78.29 | 79.21 | 80.38 | 81.30 | 82.47 |
| Camarilla | 78.89 | 79.08 | 79.27 | 79.46 | 79.65 | 79.84 | 80.04 |
| Woodie | 76.33 | 77.18 | 78.42 | 79.27 | 80.51 | 81.36 | 82.60 |
| Fibonacci | 77.12 | 77.92 | 78.41 | 79.21 | 80.01 | 80.50 | 81.30 |
| Pivot points | S3 | S2 | S1 | PP | R1 | R2 | R3 |
|---|---|---|---|---|---|---|---|
| Standard | 72.55 | 75.32 | 77.05 | 79.82 | 81.55 | 84.32 | 86.05 |
| Camarilla | 77.54 | 77.96 | 78.37 | 78.78 | 79.19 | 79.61 | 80.02 |
| Woodie | 72.03 | 75.06 | 76.53 | 79.56 | 81.03 | 84.06 | 85.53 |
| Fibonacci | 75.32 | 77.04 | 78.10 | 79.82 | 81.54 | 82.60 | 84.32 |
| Pivot points | S3 | S2 | S1 | PP | R1 | R2 | R3 |
|---|---|---|---|---|---|---|---|
| Standard | 58.90 | 68.05 | 74.94 | 84.09 | 90.98 | 100.13 | 107.02 |
| Camarilla | 77.43 | 78.90 | 80.37 | 81.84 | 83.31 | 84.78 | 86.25 |
| Woodie | 57.78 | 67.49 | 73.82 | 83.53 | 89.86 | 99.57 | 105.90 |
| Fibonacci | 68.05 | 74.17 | 77.96 | 84.09 | 90.21 | 94.00 | 100.13 |
Numerical data
The following is the status of the technical indicators and moving averages at the time of publication of this technical analysis:
| RSI (14): | 49.93 | |
| MACD (12,26,9): | -0.2300 | |
| Directional Movement: | 4.16 | |
| AROON (14): | -14.28 | |
| DEMA (21): | 78.86 | |
| Parabolic SAR (0,02-0,02-0,2): | 78.29 | |
| Elder Ray (13): | 0.01 | |
| Super Trend (3,10): | 80.48 | |
| Zig ZAG (10): | 79.38 | |
| VORTEX (21): | 1.0100 | |
| Stochastique (14,3,5): | 50.88 | |
| TEMA (21): | 79.05 | |
| Williams %R (14): | -33.49 | |
| Chande Momentum Oscillator (20): | 0.65 | |
| Repulse (5,40,3): | 0.8600 | |
| ROCnROLL: | -1 | |
| TRIX (15,9): | -0.0700 | |
| Courbe Coppock: | 0.65 |
| MA7: | 80.23 | |
| MA20: | 80.19 | |
| MA50: | 85.03 | |
| MA100: | 81.52 | |
| MAexp7: | 79.17 | |
| MAexp20: | 79.26 | |
| MAexp50: | 79.85 | |
| MAexp100: | 80.53 | |
| Price / MA7: | -1.00% | |
| Price / MA20: | -0.95% | |
| Price / MA50: | -6.59% | |
| Price / MA100: | -2.56% | |
| Price / MAexp7: | +0.33% | |
| Price / MAexp20: | +0.21% | |
| Price / MAexp50: | -0.53% | |
| Price / MAexp100: | -1.37% |
News
The latest news and videos published on MICROCHIP TECHNOLOGY INC. at the time of the analysis were as follows:
- Microchip Unveils Industry-Leading 3.3 kV Silicon Carbide (SiC) Power Devices Enabling New Levels of Efficiency and Reliability
- Computing-in-Memory Innovator Solves Speech Processing Challenges at the Edge Using Microchip’s Analog Embedded SuperFlash® Technology
- Industry’s Only Family of Standard Non-Hybrid Space-Grade Power Converters Now Includes 28 Volt (V)-Input Radiation-Tolerant Options
- Microchip and Acacia Collaborate to Enable Market Transition to 400G Pluggable Coherent Optics for Data Center Routing, Switching and Metro OTN Platforms
- DARPA Researchers Can Now Accelerate Technology Innovation Using Microchip’s Low-Power FPGA Product Families
About author
Online


Add a comment
Comments
0 comments on the analysis MICROCHIP TECHNOLOGY INC. - 1H