MICHELIN - Daily - Technical analysis published on 07/30/2024 (GMT)
- 204
- 0
Click here for a new analysis!
- Timeframe : Daily
- - Analysis generated on
- Status : INVALID
Summary of the analysis

Additional analysis
Quotes
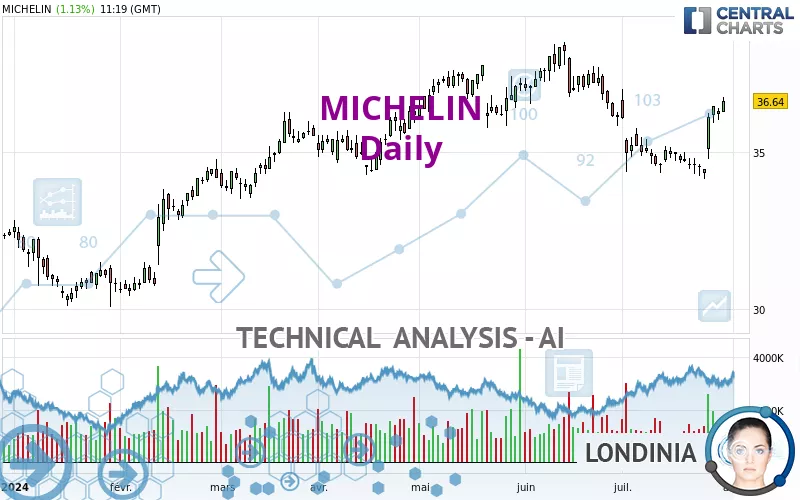
MICHELIN rating 36.64 EUR. On the day, this instrument gained +1.13% and was between 36.28 EUR and 36.75 EUR. This implies that the price is at +0.99% from its lowest and at -0.30% from its highest.The Central Gaps scanner detects a bullish opening. A small advantage for buyers in the very short term.
Bullish opening
Type : Bullish
Timeframe : Openning
Here is a more detailed summary of the historical variations registered by MICHELIN:
Near a new HIGH record (5 years)
Type : Bullish
Timeframe : Weekly
Near a new HIGH record (1 year)
Type : Bullish
Timeframe : Weekly
Near a new HIGH record (1st january)
Type : Bullish
Timeframe : Weekly
Near a new HIGH record (1 month)
Type : Bullish
Timeframe : Weekly
Technical
Technical analysis of MICHELIN in Daily shows a strongly overall bullish trend. The signals given by the moving averages are 82.14% bullish. This strong bullish trend is confirmed by the strong signals currently being given by short-term moving averages. An assessment of moving averages reveals several bullish signals that could impact this trend:
Bullish price crossover with Moving Average 50
Type : Bullish
Timeframe : Daily
Bullish price crossover with adaptative moving average 50
Type : Bullish
Timeframe : Daily
The probability of a further increase is high given the direction of the technical indicators.
Caution: the Central Indicators scanner currently detects an excess:
CCI indicator is overbought : over 100
Type : Neutral
Timeframe : Daily
Williams %R indicator is overbought : over -20
Type : Neutral
Timeframe : Daily
Pivot points : price is over resistance 2
Type : Neutral
Timeframe : Daily
Central Patterns, the market scanner focusing on chart patterns, resistances and supports found these results:
Near horizontal resistance
Type : Bearish
Timeframe : Daily
Resistance of channel is broken
Type : Bullish
Timeframe : Daily
No result was found by the Central Candlesticks scanner on Japanese candlesticks.
| S3 | S2 | S1 | Price | R1 | R2 | |
|---|---|---|---|---|---|---|
| ProTrendLines | 29.30 | 31.44 | 34.41 | 36.64 | 36.95 | 38.37 |
| Change (%) | -20.03% | -14.19% | -6.09% | - | +0.85% | +4.72% |
| Change | -7.34 | -5.20 | -2.23 | - | +0.31 | +1.73 |
| Level | Major | Intermediate | Major | - | Intermediate | Major |
To determine price objectives, it is also possible to use the pivot points. Here is the price position in relation to pivot points:
| Pivot points | S3 | S2 | S1 | PP | R1 | R2 | R3 |
|---|---|---|---|---|---|---|---|
| Standard | 35.64 | 35.84 | 36.03 | 36.23 | 36.42 | 36.62 | 36.81 |
| Camarilla | 36.12 | 36.16 | 36.19 | 36.23 | 36.27 | 36.30 | 36.34 |
| Woodie | 35.65 | 35.84 | 36.04 | 36.23 | 36.43 | 36.62 | 36.82 |
| Fibonacci | 35.84 | 35.99 | 36.08 | 36.23 | 36.38 | 36.47 | 36.62 |
| Pivot points | S3 | S2 | S1 | PP | R1 | R2 | R3 |
|---|---|---|---|---|---|---|---|
| Standard | 32.59 | 33.36 | 34.92 | 35.69 | 37.25 | 38.02 | 39.58 |
| Camarilla | 35.83 | 36.04 | 36.26 | 36.47 | 36.68 | 36.90 | 37.11 |
| Woodie | 32.98 | 33.56 | 35.31 | 35.89 | 37.64 | 38.22 | 39.97 |
| Fibonacci | 33.36 | 34.25 | 34.80 | 35.69 | 36.58 | 37.13 | 38.02 |
| Pivot points | S3 | S2 | S1 | PP | R1 | R2 | R3 |
|---|---|---|---|---|---|---|---|
| Standard | 32.45 | 34.14 | 35.13 | 36.82 | 37.81 | 39.50 | 40.49 |
| Camarilla | 35.37 | 35.62 | 35.86 | 36.11 | 36.36 | 36.60 | 36.85 |
| Woodie | 32.09 | 33.97 | 34.77 | 36.65 | 37.45 | 39.33 | 40.13 |
| Fibonacci | 34.14 | 35.17 | 35.80 | 36.82 | 37.85 | 38.48 | 39.50 |
Numerical data
The following is the status of technical indicators and moving averages registered at the time this technical analysis was created:
| RSI (14): | 62.96 | |
| MACD (12,26,9): | -0.0100 | |
| Directional Movement: | 14.26 | |
| AROON (14): | 28.57 | |
| DEMA (21): | 35.40 | |
| Parabolic SAR (0,02-0,02-0,2): | 34.32 | |
| Elder Ray (13): | 0.95 | |
| Super Trend (3,10): | 34.77 | |
| Zig ZAG (10): | 36.64 | |
| VORTEX (21): | 1.0000 | |
| Stochastique (14,3,5): | 95.16 | |
| TEMA (21): | 35.59 | |
| Williams %R (14): | -3.83 | |
| Chande Momentum Oscillator (20): | 1.57 | |
| Repulse (5,40,3): | 3.1300 | |
| ROCnROLL: | 1 | |
| TRIX (15,9): | -0.1400 | |
| Courbe Coppock: | 3.91 |
| MA7: | 35.58 | |
| MA20: | 35.15 | |
| MA50: | 36.25 | |
| MA100: | 35.37 | |
| MAexp7: | 35.86 | |
| MAexp20: | 35.55 | |
| MAexp50: | 35.66 | |
| MAexp100: | 34.95 | |
| Price / MA7: | +2.98% | |
| Price / MA20: | +4.24% | |
| Price / MA50: | +1.08% | |
| Price / MA100: | +3.59% | |
| Price / MAexp7: | +2.18% | |
| Price / MAexp20: | +3.07% | |
| Price / MAexp50: | +2.75% | |
| Price / MAexp100: | +4.84% |
News
Don't forget to follow the news on MICHELIN. At the time of publication of this analysis, the latest news was as follows:
-
 Mexican taco stand earns first Michelin star
-
Meet the U.K.'s first Black female Michelin star chef
- Sushi Ginza Onodera’s Restaurant ‘Makiyaki Ginza Onodera’ Awarded Fourth Consecutive One Michelin Star
- Best Michelin, Pirelli, Firestone & Bridgestone Tire Black Friday Deals (2023): Early All-Season, All-Terrain & More Tire Sales Reported by Retail Fuse
- Bridgestone, Firestone, Michelin & Pirelli Tire Early Black Friday Deals (2023) Researched by Consumer Walk
About author
Online


Add a comment
Comments
0 comments on the analysis MICHELIN - Daily