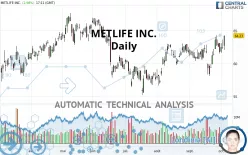
METLIFE INC. - Daily - Technical analysis published on 10/05/2021 (GMT)
- 257
- 0
Click here for a new analysis!
- Timeframe : Daily
- - Analysis generated on
- Status : LEVEL MAINTAINED

Summary of the analysis

Additional analysis
Quotes
The METLIFE INC. price is 64.22 USD. On the day, this instrument gained +2.97% with the lowest point at 62.10 USD and the highest point at 64.22 USD. The deviation from the price is +3.41% for the low point and 0% for the high point.A bullish opening was detected by the Central Gaps scanner. Buyers are trying to impose a bullish momentum in the very short term.
Bullish opening
Type : Bullish
Timeframe : Openning
Here is a more detailed summary of the historical variations registered by METLIFE INC.:
Near a new HIGH record (5 years)
Type : Bullish
Timeframe : Weekly
Near a new HIGH record (1 year)
Type : Bullish
Timeframe : Weekly
Near a new HIGH record (1st january)
Type : Bullish
Timeframe : Weekly
Near a new HIGH record (1 month)
Type : Bullish
Timeframe : Weekly
Technical
Technical analysis of this Daily chart of METLIFE INC. indicates that the overall trend is strongly bullish. 89.29% of the signals given by moving averages are bullish. The overall trend is supported by the strong bullish signals from short-term moving averages. The Central Indicators scanner does not detect any result on moving averages that would impact this trend.
Technical indicators are strongly bullish, suggesting that the price increase should continue.
Caution: the Central Indicators scanner currently detects an excess:
MACD indicator: bearish divergence
Type : Bearish
Timeframe : Daily
Pivot points : price is over resistance 1
Type : Neutral
Timeframe : Weekly
Pivot points : price is over resistance 2
Type : Neutral
Timeframe : Daily
Ichimoku - Bullish crossover : Tenkan & Kijun
Type : Bullish
Timeframe : Daily
An analysis of the price chart with the Central Patterns scanner (detector of chart patterns and resistances and supports) shows a result that can have an impact on the price change:
Near resistance of triangle
Type : Bearish
Timeframe : Daily
Central Candlesticks, the scanner specialised in Japanese candlesticks, detects these signals that could have an impact on the current short-term trend:
Bearish harami
Type : Bearish
Timeframe : Daily
Doji
Type : Neutral
Timeframe : Daily
| S3 | S2 | S1 | Price | R1 | R2 | |
|---|---|---|---|---|---|---|
| ProTrendLines | 57.50 | 61.11 | 62.96 | 64.22 | 67.09 | 70.87 |
| Change (%) | -10.46% | -4.84% | -1.96% | - | +4.47% | +10.36% |
| Change | -6.72 | -3.11 | -1.26 | - | +2.87 | +6.65 |
| Level | Major | Intermediate | Major | - | Major | Major |
To determine price objectives, it is also possible to use the pivot points. Here is the price position in relation to pivot points:
| Pivot points | S3 | S2 | S1 | PP | R1 | R2 | R3 |
|---|---|---|---|---|---|---|---|
| Standard | 60.47 | 61.36 | 61.86 | 62.75 | 63.25 | 64.14 | 64.64 |
| Camarilla | 61.99 | 62.12 | 62.24 | 62.37 | 62.50 | 62.63 | 62.75 |
| Woodie | 60.29 | 61.26 | 61.68 | 62.65 | 63.07 | 64.04 | 64.46 |
| Fibonacci | 61.36 | 61.89 | 62.22 | 62.75 | 63.28 | 63.61 | 64.14 |
| Pivot points | S3 | S2 | S1 | PP | R1 | R2 | R3 |
|---|---|---|---|---|---|---|---|
| Standard | 58.51 | 60.01 | 61.27 | 62.77 | 64.03 | 65.53 | 66.79 |
| Camarilla | 61.76 | 62.01 | 62.27 | 62.52 | 62.77 | 63.03 | 63.28 |
| Woodie | 58.38 | 59.95 | 61.14 | 62.71 | 63.90 | 65.47 | 66.66 |
| Fibonacci | 60.01 | 61.07 | 61.72 | 62.77 | 63.83 | 64.48 | 65.53 |
| Pivot points | S3 | S2 | S1 | PP | R1 | R2 | R3 |
|---|---|---|---|---|---|---|---|
| Standard | 52.35 | 55.24 | 58.49 | 61.38 | 64.63 | 67.52 | 70.77 |
| Camarilla | 60.04 | 60.60 | 61.17 | 61.73 | 62.29 | 62.86 | 63.42 |
| Woodie | 52.52 | 55.33 | 58.66 | 61.47 | 64.80 | 67.61 | 70.94 |
| Fibonacci | 55.24 | 57.59 | 59.04 | 61.38 | 63.73 | 65.18 | 67.52 |
Numerical data
The following is the status of the technical indicators and moving averages at the time of publication of this technical analysis:
| RSI (14): | 61.16 | |
| MACD (12,26,9): | 0.5500 | |
| Directional Movement: | 7.03 | |
| AROON (14): | 35.72 | |
| DEMA (21): | 62.50 | |
| Parabolic SAR (0,02-0,02-0,2): | 59.37 | |
| Elder Ray (13): | 0.98 | |
| Super Trend (3,10): | 58.62 | |
| Zig ZAG (10): | 64.20 | |
| VORTEX (21): | 1.0000 | |
| Stochastique (14,3,5): | 79.48 | |
| TEMA (21): | 62.77 | |
| Williams %R (14): | -1.38 | |
| Chande Momentum Oscillator (20): | 2.49 | |
| Repulse (5,40,3): | 2.1800 | |
| ROCnROLL: | 1 | |
| TRIX (15,9): | 0.0700 | |
| Courbe Coppock: | 4.52 |
| MA7: | 62.78 | |
| MA20: | 61.55 | |
| MA50: | 60.90 | |
| MA100: | 61.07 | |
| MAexp7: | 62.57 | |
| MAexp20: | 61.85 | |
| MAexp50: | 61.19 | |
| MAexp100: | 60.37 | |
| Price / MA7: | +2.29% | |
| Price / MA20: | +4.34% | |
| Price / MA50: | +5.45% | |
| Price / MA100: | +5.16% | |
| Price / MAexp7: | +2.64% | |
| Price / MAexp20: | +3.83% | |
| Price / MAexp50: | +4.95% | |
| Price / MAexp100: | +6.38% |
News
Don't forget to follow the news on METLIFE INC.. At the time of publication of this analysis, the latest news was as follows:
- Investor Network: MetLife, Inc. to Host Earnings Call
- MetLife Foundation & Verb Launch Competition To Accelerate Financial Innovation In Egypt & Lebanon
- MetLife Foundation & Verb Launch Competition To Accelerate Financial Innovation In Egypt & Lebanon
- SAM750 Stage Deployed in Record Time at Metlife Stadium
-
 Trump's Anti-Regulatory Stance Challenged By MetLife 'Too Big To Fail' Case
About author

Online


Add a comment
Comments
0 comments on the analysis METLIFE INC. - Daily