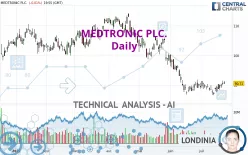
MEDTRONIC PLC. - Daily - Technical analysis published on 07/25/2022 (GMT)
- 285
- 0
Click here for a new analysis!
- Timeframe : Daily
- - Analysis generated on
- Status : LEVEL MAINTAINED

Summary of the analysis

Additional analysis
Quotes
MEDTRONIC PLC. rating 90.71 USD. The price is lower by -0.01% since the last closing and was between 90.46 USD and 91.52 USD. This implies that the price is at +0.28% from its lowest and at -0.89% from its highest.A bullish opening was detected by the Central Gaps scanner. Buyers are trying to impose a bullish momentum in the very short term.
Bullish opening
Type : Bullish
Timeframe : Openning
A study of price movements over other periods shows the following variations:
Near a new LOW record (1 year)
Type : Bearish
Timeframe : Weekly
Near a new LOW record (1st january)
Type : Bearish
Timeframe : Weekly
Near a new LOW record (1 month)
Type : Bearish
Timeframe : Weekly
Technical
A technical analysis in Daily of this MEDTRONIC PLC. chart shows a bearish trend. 71.43% of the signals given by moving averages are bearish. Caution: the neutral signals currently given by short-term moving averages show us that the global trend is losing momentum. The Central Indicators market scanner currently does not detect any result that concerns moving averages.
The technical indicators are bullish. There is still some doubt about the price increase.
Caution: the Central Indicators scanner currently detects an excess:
CCI indicator is overbought : over 100
Type : Neutral
Timeframe : Daily
Price is back under the pivot point
Type : Bearish
Timeframe : Daily
An analysis of the price chart with the Central Patterns scanner (detector of chart patterns and resistances and supports) shows several results that can have an impact on the price change:
Near horizontal resistance
Type : Bearish
Timeframe : Daily
Resistance of channel is broken
Type : Bullish
Timeframe : Daily
The Central Candlesticks scanner, specialised in Japanese candlesticks, did not identify any signals.
| S3 | S2 | S1 | Price | R1 | R2 | R3 | |
|---|---|---|---|---|---|---|---|
| ProTrendLines | 68.90 | 79.25 | 86.69 | 90.71 | 91.38 | 97.55 | 107.41 |
| Change (%) | -24.04% | -12.63% | -4.43% | - | +0.74% | +7.54% | +18.41% |
| Change | -21.81 | -11.46 | -4.02 | - | +0.67 | +6.84 | +16.70 |
| Level | Major | Intermediate | Major | - | Intermediate | Major | Minor |
Attention could also be paid to pivot points to set price objectives:
| Pivot points | S3 | S2 | S1 | PP | R1 | R2 | R3 |
|---|---|---|---|---|---|---|---|
| Standard | 88.30 | 89.15 | 89.93 | 90.78 | 91.56 | 92.41 | 93.19 |
| Camarilla | 90.27 | 90.42 | 90.57 | 90.72 | 90.87 | 91.02 | 91.17 |
| Woodie | 88.28 | 89.13 | 89.91 | 90.76 | 91.54 | 92.39 | 93.17 |
| Fibonacci | 89.15 | 89.77 | 90.15 | 90.78 | 91.40 | 91.78 | 92.41 |
| Pivot points | S3 | S2 | S1 | PP | R1 | R2 | R3 |
|---|---|---|---|---|---|---|---|
| Standard | 84.50 | 86.11 | 88.41 | 90.02 | 92.32 | 93.93 | 96.23 |
| Camarilla | 89.65 | 90.00 | 90.36 | 90.72 | 91.08 | 91.44 | 91.80 |
| Woodie | 84.86 | 86.28 | 88.77 | 90.19 | 92.68 | 94.10 | 96.59 |
| Fibonacci | 86.11 | 87.60 | 88.52 | 90.02 | 91.51 | 92.43 | 93.93 |
| Pivot points | S3 | S2 | S1 | PP | R1 | R2 | R3 |
|---|---|---|---|---|---|---|---|
| Standard | 70.91 | 78.60 | 84.17 | 91.86 | 97.43 | 105.12 | 110.69 |
| Camarilla | 86.10 | 87.32 | 88.54 | 89.75 | 90.97 | 92.18 | 93.40 |
| Woodie | 69.86 | 78.07 | 83.12 | 91.33 | 96.38 | 104.59 | 109.64 |
| Fibonacci | 78.60 | 83.66 | 86.79 | 91.86 | 96.92 | 100.05 | 105.12 |
Numerical data
The following is the status of the technical indicators and moving averages at the time of publication of this technical analysis:
| RSI (14): | 50.26 | |
| MACD (12,26,9): | -0.7700 | |
| Directional Movement: | 4.79 | |
| AROON (14): | 42.86 | |
| DEMA (21): | 88.55 | |
| Parabolic SAR (0,02-0,02-0,2): | 87.27 | |
| Elder Ray (13): | 1.29 | |
| Super Trend (3,10): | 92.53 | |
| Zig ZAG (10): | 90.65 | |
| VORTEX (21): | 1.0000 | |
| Stochastique (14,3,5): | 78.52 | |
| TEMA (21): | 89.84 | |
| Williams %R (14): | -19.61 | |
| Chande Momentum Oscillator (20): | 1.14 | |
| Repulse (5,40,3): | -0.3300 | |
| ROCnROLL: | -1 | |
| TRIX (15,9): | -0.2100 | |
| Courbe Coppock: | 0.72 |
| MA7: | 89.75 | |
| MA20: | 89.58 | |
| MA50: | 93.47 | |
| MA100: | 100.05 | |
| MAexp7: | 89.94 | |
| MAexp20: | 89.97 | |
| MAexp50: | 93.19 | |
| MAexp100: | 97.82 | |
| Price / MA7: | +1.07% | |
| Price / MA20: | +1.26% | |
| Price / MA50: | -2.95% | |
| Price / MA100: | -9.34% | |
| Price / MAexp7: | +0.86% | |
| Price / MAexp20: | +0.82% | |
| Price / MAexp50: | -2.66% | |
| Price / MAexp100: | -7.27% |
News
Don't forget to follow the news on MEDTRONIC PLC.. At the time of publication of this analysis, the latest news was as follows:
- Medtronic expands Health Equity Assistance Program for colon cancer screening with support from Amazon Web Services; Completes first installation of donated GI Genius™ intelligent endoscopy modules
- Medtronic receives FDA clearance for next-generation UNiD™ Spine Analyzer with degenerative spine surgery predictive model
- Medtronic announces co-promotion agreement with CathWorks, with path toward acquisition
- Medtronic announces co-promotion agreement with CathWorks, with path toward acquisition
- Mentice receives an initial order of USD 1.93million for simulation solutions and development services from Medtronic
About author
Online


Add a comment
Comments
0 comments on the analysis MEDTRONIC PLC. - Daily