MEDIANTECHNOLOGIES - 1H - Technical analysis published on 04/11/2024 (GMT)
- 84
- 0
Click here for a new analysis!
- Timeframe : 1H
- - Analysis generated on
- Status : TARGET REACHED

Summary of the analysis

Additional analysis
Quotes
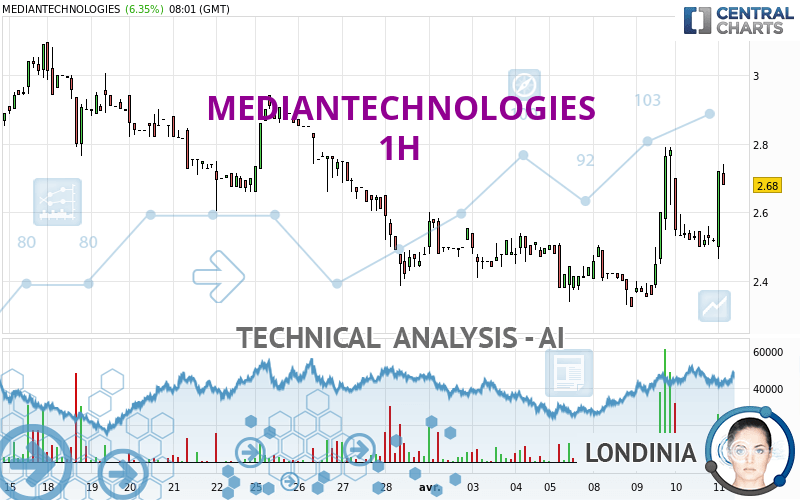
The MEDIANTECHNOLOGIES rating is 2.715 EUR. On the day, this instrument gained +7.74% with the lowest point at 2.465 EUR and the highest point at 2.720 EUR. The deviation from the price is +10.14% for the low point and -0.18% for the high point.The Central Gaps scanner detects a bearish opening marking the presence of sellers ahead of buyers at the opening but not sufficiently marked to allow the price to register a quotation gap.
Bearish opening
Type : Bearish
Timeframe : Openning
So that you have an overall view of the price change, here is a table showing the variations over several periods:
Abnormal volumes
Timeframe : 5 days
Abnormal volumes
Timeframe : 20 days
Technical
Technical analysis of this 1H chart of MEDIANTECHNOLOGIES indicates that the overall trend is bullish. 67.86% of the signals given by moving averages are bullish. The overall trend is reinforced by the strong bullish signals from short-term moving averages. The Central Indicators scanner detects bullish signals on moving averages that could impact this trend:
Bullish price crossover with Moving Average 100
Type : Bullish
Timeframe : 1 hour
Bullish price crossover with adaptative moving average 20
Type : Bullish
Timeframe : 1 hour
In fact, 13 technical indicators on 18 studied are currently bullish. Central Indicators, the detector scanner for these technical indicators has recently detected several signals:
Pivot points : price is over resistance 1
Type : Neutral
Timeframe : 1 hour
Pivot points : price is over resistance 1
Type : Neutral
Timeframe : Weekly
MACD crosses UP its Moving Average
Type : Bullish
Timeframe : 1 hour
Parabolic SAR indicator bearish reversal
Type : Bearish
Timeframe : 1 hour
Ichimoku : price is over the cloud
Type : Bullish
Timeframe : 1 hour
Williams %R indicator is back over -50
Type : Bullish
Timeframe : 1 hour
The Central Patterns scanner, which studies chart patterns, resistances and supports, has identified this signal:
Near horizontal resistance
Type : Bearish
Timeframe : 1 hour
The Central Candlesticks scanner, specialised in Japanese candlesticks, did not identify any signals.
| S3 | S2 | S1 | Price | R1 | R2 | R3 | |
|---|---|---|---|---|---|---|---|
| ProTrendLines | 2.260 | 2.507 | 2.604 | 2.715 | 2.863 | 2.940 | 3.096 |
| Change (%) | -16.76% | -7.66% | -4.09% | - | +5.45% | +8.29% | +14.03% |
| Change | -0.455 | -0.208 | -0.111 | - | +0.148 | +0.225 | +0.381 |
| Level | Major | Minor | Intermediate | - | Minor | Intermediate | Intermediate |
Pivot points can also be used to set your price objectives. Here is the price situation in relation to pivot points:
| Pivot points | S3 | S2 | S1 | PP | R1 | R2 | R3 |
|---|---|---|---|---|---|---|---|
| Standard | 2.247 | 2.373 | 2.447 | 2.573 | 2.647 | 2.773 | 2.847 |
| Camarilla | 2.465 | 2.483 | 2.502 | 2.520 | 2.538 | 2.557 | 2.575 |
| Woodie | 2.220 | 2.360 | 2.420 | 2.560 | 2.620 | 2.760 | 2.820 |
| Fibonacci | 2.373 | 2.450 | 2.497 | 2.573 | 2.650 | 2.697 | 2.773 |
| Pivot points | S3 | S2 | S1 | PP | R1 | R2 | R3 |
|---|---|---|---|---|---|---|---|
| Standard | 2.060 | 2.200 | 2.320 | 2.460 | 2.580 | 2.720 | 2.840 |
| Camarilla | 2.369 | 2.392 | 2.416 | 2.440 | 2.464 | 2.488 | 2.512 |
| Woodie | 2.050 | 2.195 | 2.310 | 2.455 | 2.570 | 2.715 | 2.830 |
| Fibonacci | 2.200 | 2.299 | 2.361 | 2.460 | 2.559 | 2.621 | 2.720 |
| Pivot points | S3 | S2 | S1 | PP | R1 | R2 | R3 |
|---|---|---|---|---|---|---|---|
| Standard | 0.802 | 1.593 | 2.037 | 2.828 | 3.272 | 4.063 | 4.507 |
| Camarilla | 2.140 | 2.254 | 2.367 | 2.480 | 2.593 | 2.706 | 2.820 |
| Woodie | 0.628 | 1.506 | 1.863 | 2.741 | 3.098 | 3.976 | 4.333 |
| Fibonacci | 1.593 | 2.065 | 2.357 | 2.828 | 3.300 | 3.592 | 4.063 |
Numerical data
The following is the status of technical indicators and moving averages registered at the time this technical analysis was created:
| RSI (14): | 58.19 | |
| MACD (12,26,9): | 0.0250 | |
| Directional Movement: | 19.855 | |
| AROON (14): | 21.429 | |
| DEMA (21): | 2.549 | |
| Parabolic SAR (0,02-0,02-0,2): | 2.790 | |
| Elder Ray (13): | 0.018 | |
| Super Trend (3,10): | 2.441 | |
| Zig ZAG (10): | 2.595 | |
| VORTEX (21): | 0.9590 | |
| Stochastique (14,3,5): | 44.54 | |
| TEMA (21): | 2.577 | |
| Williams %R (14): | -42.68 | |
| Chande Momentum Oscillator (20): | 0.040 | |
| Repulse (5,40,3): | 7.2090 | |
| ROCnROLL: | 1 | |
| TRIX (15,9): | 0.1570 | |
| Courbe Coppock: | 9.96 |
| MA7: | 2.534 | |
| MA20: | 2.694 | |
| MA50: | 3.332 | |
| MA100: | 3.813 | |
| MAexp7: | 2.558 | |
| MAexp20: | 2.518 | |
| MAexp50: | 2.508 | |
| MAexp100: | 2.580 | |
| Price / MA7: | +7.14% | |
| Price / MA20: | +0.78% | |
| Price / MA50: | -18.52% | |
| Price / MA100: | -28.80% | |
| Price / MAexp7: | +6.14% | |
| Price / MAexp20: | +7.82% | |
| Price / MAexp50: | +8.25% | |
| Price / MAexp100: | +5.23% |
News
The last news published on MEDIANTECHNOLOGIES at the time of the generation of this analysis was as follows:
- Median Technologies Reports 2023 Revenue and Summarizes 2024 Strategic Outlook
- Median Technologies: Disclosure of Total Number of Voting Rights and Number of Shares in the Capital as of July 31st, 2023
- Median Technologies: Financial Communication Schedule for the Second Half of 2023
- Portzamparc Groupe BNP Paribas Initiates the Coverage of Median Technologies with a “Strong Buy” Recommendation
- Median Technologies to Host Two Webcasts and Provide a Company Update on July 20, 2023
About author

Online


Add a comment
Comments
0 comments on the analysis MEDIANTECHNOLOGIES - 1H