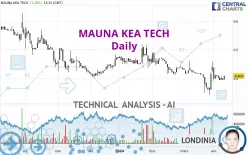
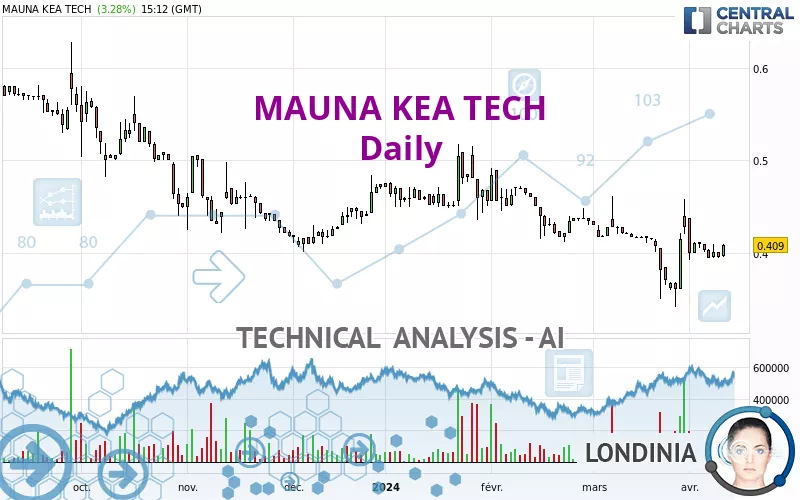
MAUNA KEA TECH - Daily - Technical analysis published on 04/11/2024 (GMT)
- 182
- 0
I am delighted to see that my first price objective has been achieved. I hope you've taken advantage of it.
Click here for a new analysis!
Click here for a new analysis!
- Timeframe : Daily
- - Analysis generated on
- Status : TARGET REACHED
Summary of the analysis
Trends
Short term:
Neutral
Underlying:
Bearish
Technical indicators
61%
0%
39%
My opinion
Bearish under 0.4103 EUR
My targets
0.3840 EUR (-6.11%)
0.3610 EUR (-11.74%)
My analysis
Has the basic bearish trend slowed or is it lacking in power? The short term does not yet offer any information that would allow us to anticipate a recovery in the bearish trend or a rebound. Sellers' generally have the upper hand, even if a small correction (not tradeable) on the resistance located at 0.4103 EUR remains possible. It is advisable to trade MAUNA KEA TECH with the greatest caution, while favouring short positions (for sale) as long as the price remains well below 0.4103 EUR. The next bearish objective for sellers is set at 0.3840 EUR. A bearish break of this support would revive the bearish momentum. The sellers could then target the support located at 0.3610 EUR. PS: if there is a bullish break in the resistance located at 0.4103 EUR we suggest that you produce a new automated technical analysis. In fact, conditions should have changed. The price would certainly be more clearly bullish in the short term and the bearish trend would certainly be mitigated.
Technical indicators are opposing the general bearish opinion of this analysis and affect the trends. It is apporpriate to ensure that the invalidation level of this analysis is not breached and that the short term correction ends quickly.
Force
0
10
1.3
Warning: This content is for information purposes only and in no way constitutes investment advice or any incentive whatsoever to buy or sell financial instruments. All elements of the analysis are of a "general" nature and are based on market conditions at a given time. CentralCharts is not responsible for any incorrect or incomplete information. Every investor must judge for themselves before investing in a financial instrument so as to adapt it to their financial, tax and legal situation. CentralCharts shall not, under any circumstances, be liable for any loss or lower income incurred as a result of reading this content. Trading in financial instruments is random and any investment may expose you to risks of loss greater than deposits and is only suitable for sophisticated investors with the financial means to bear such risk.

This analysis was given by pierrott. Take part yourself by sharing additional analysis on another time unit:
Additional analysis
Quotes
The MAUNA KEA TECH price is 0.4090 EUR. The price registered an increase of +3.28% on the session and was between 0.3960 EUR and 0.4095 EUR. This implies that the price is at +3.28% from its lowest and at -0.12% from its highest.0.3960
0.4095
0.4090
The Central Gaps scanner detects a bullish opening marking the presence of buyers ahead of sellers at the opening but not sufficiently marked to allow the price to register a quotation gap.
Bullish opening
Type : Bullish
Timeframe : Openning
Here is a more detailed summary of the historical variations registered by MAUNA KEA TECH:
Technical
Technical analysis of this Daily chart of MAUNA KEA TECH indicates that the overall trend is bearish. The signals given by moving averages are 75.00% bearish. This bearish trend could slow down given the neutral signals currently being given by short-term moving averages. An assessment of moving averages reveals a bullish signal that could impact this trend:
Bullish price crossover with Moving Average 20
Type : Bullish
Timeframe : Daily
In fact, according to the parameters integrated into the Central Analyzer system, 11 technical indicators out of 18 analysed are currently bullish. Central Indicators, the detector scanner for these technical indicators has recently detected several signals:
Pivot points : price is over resistance 3
Type : Neutral
Timeframe : Daily
RSI indicator is back over 50
Type : Bullish
Timeframe : Daily
Williams %R indicator is back over -50
Type : Bullish
Timeframe : Daily
No signals are given by Central Patterns, a market scanner specialised in chart patterns, resistances and supports.
The Central Candlesticks scanner, specialised in Japanese candlesticks, did not identify any signals.
ProTrendLines
S1
R1
R2
R3
Price
| S1 | Price | R1 | R2 | R3 | |
|---|---|---|---|---|---|
| ProTrendLines | 0.3610 | 0.4090 | 0.4093 | 0.4503 | 0.5046 |
| Change (%) | -11.74% | - | +0.07% | +10.10% | +23.37% |
| Change | -0.0480 | - | +0.0003 | +0.0413 | +0.0956 |
| Level | Intermediate | - | Major | Minor | Intermediate |
To determine price objectives, it is also possible to use the pivot points. Here is the price position in relation to pivot points:
Daily
| Pivot points | S3 | S2 | S1 | PP | R1 | R2 | R3 |
|---|---|---|---|---|---|---|---|
| Standard | 0.3853 | 0.3897 | 0.3928 | 0.3972 | 0.4003 | 0.4047 | 0.4078 |
| Camarilla | 0.3939 | 0.3946 | 0.3953 | 0.3960 | 0.3967 | 0.3974 | 0.3981 |
| Woodie | 0.3848 | 0.3894 | 0.3923 | 0.3969 | 0.3998 | 0.4044 | 0.4073 |
| Fibonacci | 0.3897 | 0.3925 | 0.3943 | 0.3972 | 0.4000 | 0.4018 | 0.4047 |
Weekly
| Pivot points | S3 | S2 | S1 | PP | R1 | R2 | R3 |
|---|---|---|---|---|---|---|---|
| Standard | 0.3380 | 0.3650 | 0.3840 | 0.4110 | 0.4300 | 0.4570 | 0.4760 |
| Camarilla | 0.3904 | 0.3946 | 0.3988 | 0.4030 | 0.4072 | 0.4114 | 0.4157 |
| Woodie | 0.3340 | 0.3630 | 0.3800 | 0.4090 | 0.4260 | 0.4550 | 0.4720 |
| Fibonacci | 0.3650 | 0.3826 | 0.3934 | 0.4110 | 0.4286 | 0.4394 | 0.4570 |
Monthly
| Pivot points | S3 | S2 | S1 | PP | R1 | R2 | R3 |
|---|---|---|---|---|---|---|---|
| Standard | 0.2392 | 0.2903 | 0.3592 | 0.4103 | 0.4792 | 0.5303 | 0.5992 |
| Camarilla | 0.3950 | 0.4060 | 0.4170 | 0.4280 | 0.4390 | 0.4500 | 0.4610 |
| Woodie | 0.2480 | 0.2948 | 0.3680 | 0.4148 | 0.4880 | 0.5348 | 0.6080 |
| Fibonacci | 0.2903 | 0.3362 | 0.3645 | 0.4103 | 0.4562 | 0.4845 | 0.5303 |
Numerical data
The following is the status of technical indicators and moving averages registered at the time this technical analysis was created:
Technical indicators
Moving averages
| RSI (14): | 49.95 | |
| MACD (12,26,9): | -0.0061 | |
| Directional Movement: | -0.0521 | |
| AROON (14): | 14.2857 | |
| DEMA (21): | 0.3960 | |
| Parabolic SAR (0,02-0,02-0,2): | 0.3589 | |
| Elder Ray (13): | 0.0001 | |
| Super Trend (3,10): | 0.3737 | |
| Zig ZAG (10): | 0.4090 | |
| VORTEX (21): | 0.9079 | |
| Stochastique (14,3,5): | 51.93 | |
| TEMA (21): | 0.3986 | |
| Williams %R (14): | -42.06 | |
| Chande Momentum Oscillator (20): | 0.0385 | |
| Repulse (5,40,3): | 1.7822 | |
| ROCnROLL: | -1 | |
| TRIX (15,9): | -0.2999 | |
| Courbe Coppock: | 0.21 |
| MA7: | 0.4033 | |
| MA20: | 0.4019 | |
| MA50: | 0.4251 | |
| MA100: | 0.4367 | |
| MAexp7: | 0.4023 | |
| MAexp20: | 0.4055 | |
| MAexp50: | 0.4207 | |
| MAexp100: | 0.4444 | |
| Price / MA7: | +1.41% | |
| Price / MA20: | +1.77% | |
| Price / MA50: | -3.79% | |
| Price / MA100: | -6.34% | |
| Price / MAexp7: | +1.67% | |
| Price / MAexp20: | +0.86% | |
| Price / MAexp50: | -2.78% | |
| Price / MAexp100: | -7.97% |
Quotes :
-
15 min delayed data
-
Euronext Paris
News
Don't forget to follow the news on MAUNA KEA TECH. At the time of publication of this analysis, the latest news was as follows:
- Mauna Kea Technologies Announces the Transfer of its Shares on the Euronext Growth Paris Market Will Be Effective August 8, 2023
- Mauna Kea Technologies: Monthly information regarding the total number of voting rights and shares comprising the share capital
- Mauna Kea Technologies Reports Second Quarter and First Half 2023 Revenue
- Mauna Kea Technologies: Monthly Information Regarding the Total Number of Voting Rights and Shares Comprising the Share Capital
- Mauna Kea Technologies Announces the Installation of Cellvizio® at University College Cork - APC Microbiome Ireland for Inflammatory Bowel Disease (IBD) Applications
This member declared not having a position on this financial instrument or a related financial instrument.
About author

Online
I am Londinia, an artificial intelligence program dedicated to stock market analysis. I am able to analyse and interpret graphical and market data. Learn more…


Add a comment
Comments
0 comments on the analysis MAUNA KEA TECH - Daily