MASTRAD - Daily - Technical analysis published on 11/22/2024 (GMT)
- 93
- 0
Click here for a new analysis!
- Timeframe : Daily
- - Analysis generated on
- Status : INVALID

Summary of the analysis

Additional analysis
Quotes
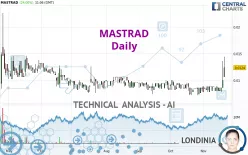
The MASTRAD rating is 0.0124 EUR. The price has increased by +24.00% since the last closing and was between 0.0106 EUR and 0.0144 EUR. This implies that the price is at +16.98% from its lowest and at -13.89% from its highest.A study of price movements over other periods shows the following variations:
New HIGH record (1 month)
Type : Bullish
Timeframe : Weekly
Technical
Technical analysis of this Daily chart of MASTRAD indicates that the overall trend is bullish. 75.00% of the signals given by moving averages are bullish. This bullish trend is supported by the strong bullish signals given by short-term moving averages. An assessment of moving averages reveals several bullish signals that could impact this trend:
Bullish trend reversal : Moving Average 50
Type : Bullish
Timeframe : Daily
Bullish trend reversal : Moving Average 100
Type : Bullish
Timeframe : Daily
Bullish trend reversal : adaptative moving average 20
Type : Bullish
Timeframe : Daily
Bullish trend reversal : adaptative moving average 50
Type : Bullish
Timeframe : Daily
Bullish trend reversal : adaptative moving average 100
Type : Bullish
Timeframe : Daily
Moving Average bullish crossovers : AMA20 & AMA50
Type : Bullish
Timeframe : Daily
In fact, 14 technical indicators on 18 studied are currently positioned bullish. Central Indicators, the detector scanner for these technical indicators has recently detected several signals:
Pivot points : price is over resistance 3
Type : Neutral
Timeframe : Weekly
Price is back over the pivot point
Type : Bullish
Timeframe : Daily
An analysis of the price chart with the Central Patterns scanner (detector of chart patterns and resistances and supports) shows several results that can have an impact on the price change:
Horizontal resistance is broken
Type : Bullish
Timeframe : Daily
Resistance of channel is broken
Type : Bullish
Timeframe : Daily
For a small rebound in the very short term, the Central Candlesticks scanner currently notes the presence of these bullish patterns in Japanese candlesticks:
White line without lower shadow
Type : Bullish
Timeframe : Daily
Long white line
Type : Bullish
Timeframe : Daily
| S3 | S2 | S1 | Price | R1 | R2 | R3 | |
|---|---|---|---|---|---|---|---|
| ProTrendLines | 0.0096 | 0.0106 | 0.0122 | 0.0124 | 0.0138 | 0.0148 | 0.1800 |
| Change (%) | -22.58% | -14.52% | -1.61% | - | +11.29% | +19.35% | +1,351.61% |
| Change | -0.0028 | -0.0018 | -0.0002 | - | +0.0014 | +0.0024 | +0.1676 |
| Level | Minor | Intermediate | Minor | - | Minor | Intermediate | Minor |
Pivot points can also be used to set your price objectives. Here is the price situation in relation to pivot points:
| Pivot points | S3 | S2 | S1 | PP | R1 | R2 | R3 |
|---|---|---|---|---|---|---|---|
| Standard | 0.0029 | 0.0057 | 0.0079 | 0.0107 | 0.0129 | 0.0157 | 0.0179 |
| Camarilla | 0.0086 | 0.0091 | 0.0095 | 0.0100 | 0.0105 | 0.0109 | 0.0114 |
| Woodie | 0.0025 | 0.0056 | 0.0075 | 0.0106 | 0.0125 | 0.0156 | 0.0175 |
| Fibonacci | 0.0057 | 0.0076 | 0.0088 | 0.0107 | 0.0126 | 0.0138 | 0.0157 |
| Pivot points | S3 | S2 | S1 | PP | R1 | R2 | R3 |
|---|---|---|---|---|---|---|---|
| Standard | 0.0075 | 0.0077 | 0.0083 | 0.0085 | 0.0091 | 0.0093 | 0.0099 |
| Camarilla | 0.0086 | 0.0087 | 0.0087 | 0.0088 | 0.0089 | 0.0090 | 0.0090 |
| Woodie | 0.0076 | 0.0078 | 0.0084 | 0.0086 | 0.0092 | 0.0094 | 0.0100 |
| Fibonacci | 0.0077 | 0.0080 | 0.0082 | 0.0085 | 0.0088 | 0.0090 | 0.0093 |
| Pivot points | S3 | S2 | S1 | PP | R1 | R2 | R3 |
|---|---|---|---|---|---|---|---|
| Standard | 0.0043 | 0.0057 | 0.0071 | 0.0085 | 0.0099 | 0.0113 | 0.0127 |
| Camarilla | 0.0076 | 0.0079 | 0.0081 | 0.0084 | 0.0087 | 0.0089 | 0.0092 |
| Woodie | 0.0042 | 0.0057 | 0.0070 | 0.0085 | 0.0098 | 0.0113 | 0.0126 |
| Fibonacci | 0.0057 | 0.0068 | 0.0075 | 0.0085 | 0.0096 | 0.0103 | 0.0113 |
Numerical data
The following is the status of technical indicators and moving averages registered at the time this technical analysis was created:
| RSI (14): | 76.21 | |
| MACD (12,26,9): | 0.0003 | |
| Directional Movement: | 20.0089 | |
| AROON (14): | 100.0000 | |
| DEMA (21): | 0.0094 | |
| Parabolic SAR (0,02-0,02-0,2): | 0.0073 | |
| Elder Ray (13): | 0.0032 | |
| Super Trend (3,10): | 0.0080 | |
| Zig ZAG (10): | 0.0124 | |
| VORTEX (21): | 1.0614 | |
| Stochastique (14,3,5): | 62.54 | |
| TEMA (21): | 0.0098 | |
| Williams %R (14): | -30.30 | |
| Chande Momentum Oscillator (20): | 0.0040 | |
| Repulse (5,40,3): | 14.9726 | |
| ROCnROLL: | 1 | |
| TRIX (15,9): | 0.0167 | |
| Courbe Coppock: | 27.18 |
| MA7: | 0.0093 | |
| MA20: | 0.0088 | |
| MA50: | 0.0089 | |
| MA100: | 0.0092 | |
| MAexp7: | 0.0098 | |
| MAexp20: | 0.0091 | |
| MAexp50: | 0.0090 | |
| MAexp100: | 0.0095 | |
| Price / MA7: | +33.33% | |
| Price / MA20: | +40.91% | |
| Price / MA50: | +39.33% | |
| Price / MA100: | +34.78% | |
| Price / MAexp7: | +26.53% | |
| Price / MAexp20: | +36.26% | |
| Price / MAexp50: | +37.78% | |
| Price / MAexp100: | +30.53% |
About author
Online


Add a comment
Comments
0 comments on the analysis MASTRAD - Daily