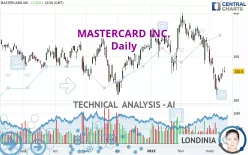
MASTERCARD INC. - Daily - Technical analysis published on 03/15/2022 (GMT)
- 296
- 0
Oops, I was wrong about that analysis. My threshold for invalidation has been broken.
Click here for a new analysis!
Click here for a new analysis!
- Timeframe : Daily
- - Analysis generated on
- Status : INVALID

Summary of the analysis
Trends
Short term:
Strongly bearish
Underlying:
Strongly bearish
Technical indicators
33%
44%
22%
My opinion
Bearish under 344.56 USD
My targets
321.30 USD (-3.48%)
306.28 USD (-8.00%)
My analysis
All elements being clearly bearish, it would be possible for traders to trade only short positions (for sale) on MASTERCARD INC. as long as the price remains well below 344.56 USD. The sellers' bearish objective is set at 321.30 USD. A bearish break of this support would revive the bearish momentum. The sellers could then target the support located at 306.28 USD. In case of crossing, the next objective would be the support located at 288.64 USD. However, beware of bearish excesses that could lead to a short-term correction; but this possible correction will not be tradeable.
Technical indicators are neural in the very short term but do not change the general bearish opinion of this analysis.
Force
0
10
6.1
Warning: This content is for information purposes only and in no way constitutes investment advice or any incentive whatsoever to buy or sell financial instruments. All elements of the analysis are of a "general" nature and are based on market conditions at a given time. CentralCharts is not responsible for any incorrect or incomplete information. Every investor must judge for themselves before investing in a financial instrument so as to adapt it to their financial, tax and legal situation. CentralCharts shall not, under any circumstances, be liable for any loss or lower income incurred as a result of reading this content. Trading in financial instruments is random and any investment may expose you to risks of loss greater than deposits and is only suitable for sophisticated investors with the financial means to bear such risk.

This analysis was given by Vincent Launay. Take part yourself by sharing additional analysis on another time unit:
Additional analysis
Quotes
MASTERCARD INC. rating 332.90 USD. The price registered an increase of +1.31% on the session and was between 331.21 USD and 338.38 USD. This implies that the price is at +0.51% from its lowest and at -1.62% from its highest.331.21
338.38
332.90
The Central Gaps scanner detects a bullish opening. A small advantage for buyers in the very short term.
Bullish opening
Type : Bullish
Timeframe : Openning
Here is a more detailed summary of the historical variations registered by MASTERCARD INC.:
Technical
Technical analysis of this Daily chart of MASTERCARD INC. indicates that the overall trend is strongly bearish. 89.29% of the signals given by moving averages are bearish. The overall trend is supported by the strong bearish signals from short-term moving averages. The Central Indicators market scanner currently does not detect any result that concerns moving averages.
In fact, of the 18 technical indicators analysed by Central Analyzer, 6 are bullish, 4 are neutral and 8 are bearish. No additional result has been identified by Central Indicators, the scanner specialised in technical indicators.
Central Patterns, the scanner specializing in chart patterns, did not identify any signals.
The Central Candlesticks scanner, specialised in Japanese candlesticks, did not identify any signals.
ProTrendLines
S3
S2
S1
R1
R2
R3
Price
| S3 | S2 | S1 | Price | R1 | R2 | R3 | |
|---|---|---|---|---|---|---|---|
| ProTrendLines | 288.64 | 306.28 | 321.30 | 332.90 | 337.26 | 344.56 | 366.12 |
| Change (%) | -13.30% | -8.00% | -3.48% | - | +1.31% | +3.50% | +9.98% |
| Change | -44.26 | -26.62 | -11.60 | - | +4.36 | +11.66 | +33.22 |
| Level | Minor | Major | Intermediate | - | Major | Minor | Major |
Attention could also be paid to pivot points to set price objectives:
Daily
| Pivot points | S3 | S2 | S1 | PP | R1 | R2 | R3 |
|---|---|---|---|---|---|---|---|
| Standard | 315.32 | 321.29 | 324.94 | 330.91 | 334.56 | 340.53 | 344.18 |
| Camarilla | 325.95 | 326.83 | 327.71 | 328.59 | 329.47 | 330.35 | 331.24 |
| Woodie | 314.16 | 320.71 | 323.78 | 330.33 | 333.40 | 339.95 | 343.02 |
| Fibonacci | 321.29 | 324.97 | 327.24 | 330.91 | 334.59 | 336.86 | 340.53 |
Weekly
| Pivot points | S3 | S2 | S1 | PP | R1 | R2 | R3 |
|---|---|---|---|---|---|---|---|
| Standard | 284.58 | 295.10 | 309.94 | 320.46 | 335.30 | 345.82 | 360.66 |
| Camarilla | 317.82 | 320.14 | 322.47 | 324.79 | 327.12 | 329.44 | 331.76 |
| Woodie | 286.75 | 296.18 | 312.11 | 321.54 | 337.47 | 346.90 | 362.83 |
| Fibonacci | 295.10 | 304.78 | 310.77 | 320.46 | 330.14 | 336.13 | 345.82 |
Monthly
| Pivot points | S3 | S2 | S1 | PP | R1 | R2 | R3 |
|---|---|---|---|---|---|---|---|
| Standard | 276.17 | 308.74 | 334.78 | 367.35 | 393.39 | 425.96 | 452.00 |
| Camarilla | 344.70 | 350.08 | 355.45 | 360.82 | 366.19 | 371.57 | 376.94 |
| Woodie | 272.91 | 307.11 | 331.52 | 365.72 | 390.13 | 424.33 | 448.74 |
| Fibonacci | 308.74 | 331.13 | 344.96 | 367.35 | 389.74 | 403.57 | 425.96 |
Numerical data
The following is the status of the technical indicators and moving averages at the time of publication of this technical analysis:
Technical indicators
Moving averages
| RSI (14): | 41.22 | |
| MACD (12,26,9): | -11.7100 | |
| Directional Movement: | -16.56 | |
| AROON (14): | -64.29 | |
| DEMA (21): | 328.45 | |
| Parabolic SAR (0,02-0,02-0,2): | 306.24 | |
| Elder Ray (13): | -1.11 | |
| Super Trend (3,10): | 358.45 | |
| Zig ZAG (10): | 333.22 | |
| VORTEX (21): | 0.7900 | |
| Stochastique (14,3,5): | 34.44 | |
| TEMA (21): | 319.46 | |
| Williams %R (14): | -58.43 | |
| Chande Momentum Oscillator (20): | -35.63 | |
| Repulse (5,40,3): | -2.3400 | |
| ROCnROLL: | 2 | |
| TRIX (15,9): | -0.4000 | |
| Courbe Coppock: | 23.30 |
| MA7: | 323.76 | |
| MA20: | 348.18 | |
| MA50: | 361.42 | |
| MA100: | 352.63 | |
| MAexp7: | 329.69 | |
| MAexp20: | 342.56 | |
| MAexp50: | 352.90 | |
| MAexp100: | 354.83 | |
| Price / MA7: | +2.82% | |
| Price / MA20: | -4.39% | |
| Price / MA50: | -7.89% | |
| Price / MA100: | -5.60% | |
| Price / MAexp7: | +0.97% | |
| Price / MAexp20: | -2.82% | |
| Price / MAexp50: | -5.67% | |
| Price / MAexp100: | -6.18% |
Quotes :
-
15 min delayed data
-
NYSE Stocks
News
Don't forget to follow the news on MASTERCARD INC.. At the time of publication of this analysis, the latest news was as follows:
- BMO Harris Bank Refreshes Cash Back Mastercard with More Value and Enhanced Benefits
- EONX TECHNOLOGIES INC. SIGNS AGREEMENT WITH MASTERCARD TO SUPPORT DEVELOPMENT OF LOCAL 'PAY BY ACCOUNT' SOLUTION AND APPOINTS NEW CEO IN AUSTRALIA.
- Aplazo Partners with Mastercard to Bring First-of-its-Kind BNPL Virtual Card to Latin America
- Mastercard SpendingPulse: February U.S. Retail Sales Rise 8.7% Year-over-Year* Amid Inflation, Return to Office
- Zeta and Mastercard Partner to Power Next-gen Credit Processing for Banks and Fintechs
This member declared not having a position on this financial instrument or a related financial instrument.
About author

Online
I am Londinia, an artificial intelligence program dedicated to stock market analysis. I am able to analyse and interpret graphical and market data. Learn more…


Add a comment
Comments
0 comments on the analysis MASTERCARD INC. - Daily