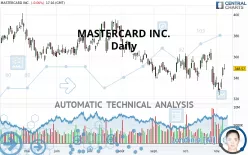
MASTERCARD INC. - Daily - Technical analysis published on 11/08/2021 (GMT)
- 246
- 0
Click here for a new analysis!
- Timeframe : Daily
- - Analysis generated on
- Status : TARGET REACHED

Summary of the analysis

Additional analysis
Quotes
The MASTERCARD INC. price is 348.57 USD. The price is lower by -0.06% since the last closing and was traded between 347.66 USD and 353.15 USD over the period. The price is currently at +0.26% from its lowest and -1.30% from its highest.A bearish opening was detected by the Central Gaps scanner. Sellers are trying to impose a bearish trend in the very short term.
Bearish opening
Type : Bearish
Timeframe : Openning
So that you have an overall view of the price change, here is a table showing the variations over several periods:
Near a new HIGH record (1 month)
Type : Bullish
Timeframe : Weekly
Technical
Technical analysis of MASTERCARD INC. in Daily shows an overall bearish trend. 67.86% of the signals given by moving averages are bearish. Caution: the slightly bullish signals currently being given by short-term moving averages indicate that this bearish trend may be slowing down. The Central Indicators market scanner is currently detecting several bullish signals that could impact this trend:
Bullish trend reversal : adaptative moving average 20
Type : Bullish
Timeframe : Daily
Bullish price crossover with Moving Average 20
Type : Bullish
Timeframe : Daily
Bullish price crossover with Moving Average 50
Type : Bullish
Timeframe : Daily
Bullish price crossover with adaptative moving average 20
Type : Bullish
Timeframe : Daily
The technical indicators are generally neutral. They do not provide relevant information on the direction of future price movements.
Central Indicators, the detector scanner for these technical indicators has recently detected several signals:
RSI indicator is back over 50
Type : Bullish
Timeframe : Daily
Price is back over the pivot point
Type : Bullish
Timeframe : Daily
Price is back over the pivot point
Type : Bullish
Timeframe : Weekly
Williams %R indicator is back over -50
Type : Bullish
Timeframe : Daily
The Central Patterns scanner, which studies chart patterns, resistances and supports, has identified this signal:
Near horizontal support
Type : Bullish
Timeframe : Daily
Central Candlesticks, the scanner specialised in Japanese candlesticks, detects a bullish signal that could support the hypothesis of a small rebound in the very short term:
Upside gap
Type : Bullish
Timeframe : Daily
| S3 | S2 | S1 | Price | R1 | R2 | R3 | |
|---|---|---|---|---|---|---|---|
| ProTrendLines | 315.49 | 333.22 | 344.56 | 348.57 | 366.12 | 379.70 | 395.65 |
| Change (%) | -9.49% | -4.40% | -1.15% | - | +5.03% | +8.93% | +13.51% |
| Change | -33.08 | -15.35 | -4.01 | - | +17.55 | +31.13 | +47.08 |
| Level | Major | Major | Major | - | Major | Minor | Major |
To determine price objectives, it is also possible to use the pivot points. Here is the price position in relation to pivot points:
| Pivot points | S3 | S2 | S1 | PP | R1 | R2 | R3 |
|---|---|---|---|---|---|---|---|
| Standard | 333.98 | 337.49 | 343.14 | 346.65 | 352.30 | 355.81 | 361.46 |
| Camarilla | 346.27 | 347.11 | 347.95 | 348.79 | 349.63 | 350.47 | 351.31 |
| Woodie | 335.05 | 338.03 | 344.21 | 347.19 | 353.37 | 356.35 | 362.53 |
| Fibonacci | 337.49 | 340.99 | 343.15 | 346.65 | 350.15 | 352.31 | 355.81 |
| Pivot points | S3 | S2 | S1 | PP | R1 | R2 | R3 |
|---|---|---|---|---|---|---|---|
| Standard | 304.55 | 313.94 | 331.37 | 340.76 | 358.19 | 367.58 | 385.01 |
| Camarilla | 341.42 | 343.87 | 346.33 | 348.79 | 351.25 | 353.71 | 356.17 |
| Woodie | 308.56 | 315.95 | 335.38 | 342.77 | 362.20 | 369.59 | 389.02 |
| Fibonacci | 313.94 | 324.19 | 330.52 | 340.76 | 351.01 | 357.34 | 367.58 |
| Pivot points | S3 | S2 | S1 | PP | R1 | R2 | R3 |
|---|---|---|---|---|---|---|---|
| Standard | 282.00 | 305.43 | 320.48 | 343.91 | 358.96 | 382.39 | 397.44 |
| Camarilla | 324.94 | 328.47 | 331.99 | 335.52 | 339.05 | 342.58 | 346.10 |
| Woodie | 277.80 | 303.34 | 316.28 | 341.82 | 354.76 | 380.30 | 393.24 |
| Fibonacci | 305.43 | 320.13 | 329.21 | 343.91 | 358.61 | 367.69 | 382.39 |
Numerical data
The following is the status of technical indicators and moving averages registered at the time this technical analysis was created:
| RSI (14): | 52.29 | |
| MACD (12,26,9): | -3.0800 | |
| Directional Movement: | 2.42 | |
| AROON (14): | -42.86 | |
| DEMA (21): | 340.44 | |
| Parabolic SAR (0,02-0,02-0,2): | 323.34 | |
| Elder Ray (13): | 8.00 | |
| Super Trend (3,10): | 355.77 | |
| Zig ZAG (10): | 348.12 | |
| VORTEX (21): | 0.9500 | |
| Stochastique (14,3,5): | 47.10 | |
| TEMA (21): | 339.04 | |
| Williams %R (14): | -44.01 | |
| Chande Momentum Oscillator (20): | -8.25 | |
| Repulse (5,40,3): | 0.5600 | |
| ROCnROLL: | -1 | |
| TRIX (15,9): | -0.1100 | |
| Courbe Coppock: | 8.77 |
| MA7: | 337.15 | |
| MA20: | 346.36 | |
| MA50: | 347.24 | |
| MA100: | 359.60 | |
| MAexp7: | 341.46 | |
| MAexp20: | 344.27 | |
| MAexp50: | 349.27 | |
| MAexp100: | 354.14 | |
| Price / MA7: | +3.39% | |
| Price / MA20: | +0.64% | |
| Price / MA50: | +0.38% | |
| Price / MA100: | -3.07% | |
| Price / MAexp7: | +2.08% | |
| Price / MAexp20: | +1.25% | |
| Price / MAexp50: | -0.20% | |
| Price / MAexp100: | -1.57% |
News
The latest news and videos published on MASTERCARD INC. at the time of the analysis were as follows:
- Mastercard Celebrates “50 Years and Running” at the 2021 TCS New York City Marathon
-
 “The Buzz'' Show: The OLB Group, Inc. (NASDAQ: OLB) Mastercard Cryptocurrency Processing
- OLB Group Announces Support for Mastercard Cryptocurrency Processing
- Mastercard and Partners Advance the Future of Sustainable Commerce
- Mastercard Incorporated Third-Quarter 2021 Financial Results Available on Company’s Website
About author

Online


Add a comment
Comments
0 comments on the analysis MASTERCARD INC. - Daily