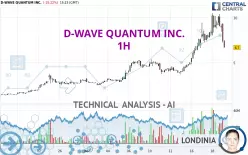
D-WAVE QUANTUM INC. - 1H - Technical analysis published on 12/19/2024 (GMT)
- 144
- 0
Click here for a new analysis!
- Timeframe : 1H
- - Analysis generated on
- Status : INVALID

Summary of the analysis

Additional analysis
Quotes
D-WAVE QUANTUM INC. rating 6.70 USD. On the day, this instrument lost -25.22% with the lowest point at 6.70 USD and the highest point at 9.38 USD. The deviation from the price is 0% for the low point and -28.57% for the high point.The Central Gaps scanner detects a bullish opening marking the presence of buyers ahead of sellers at the opening but not sufficiently marked to allow the price to register a quotation gap.
Bullish opening
Type : Bullish
Timeframe : Openning
So that you have an overall view of the price change, here is a table showing the variations over several periods:
New HIGH record (1 year)
Type : Bullish
Timeframe : Weekly
New HIGH record (1st january)
Type : Bullish
Timeframe : Weekly
New HIGH record (1 month)
Type : Bullish
Timeframe : Weekly
Abnormal volumes on D-WAVE QUANTUM INC. were detected by the Central Volumes scanner:
Abnormal volumes
Timeframe : 5 days
Abnormal volumes
Timeframe : 20 days
Abnormal volumes
Timeframe : 50 days
Technical
A technical analysis in 1H of this D-WAVE QUANTUM INC. chart shows a bullish trend. 78.57% of the signals given by moving averages are bullish. Caution: the neutral signals currently given by the short-term moving averages indicate that this bullish trend is showing signs of running out of steam. An assessment of moving averages reveals a bearish signal that could impact this trend:
Bearish trend reversal : adaptative moving average 20
Type : Bearish
Timeframe : 1 hour
In fact, only 8 technical indicators out of 18 studied are currently bearish. Caution: the Central Indicators scanner currently detects an excess:
Williams %R indicator is oversold : under -80
Type : Neutral
Timeframe : 1 hour
Pivot points : price is over resistance 2
Type : Neutral
Timeframe : Weekly
Pivot points : price is under support 1
Type : Neutral
Timeframe : 1 hour
Central Patterns, the scanner specializing in chart patterns, did not identify any signals.
No result was found by the Central Candlesticks scanner on Japanese candlesticks.
| S3 | S2 | S1 | Price | R1 | R2 | |
|---|---|---|---|---|---|---|
| ProTrendLines | 2.91 | 3.74 | 5.06 | 6.70 | 9.42 | 10.50 |
| Change (%) | -56.57% | -44.18% | -24.48% | - | +40.60% | +56.72% |
| Change | -3.79 | -2.96 | -1.64 | - | +2.72 | +3.80 |
| Level | Major | Major | Intermediate | - | Minor | Intermediate |
Pivot points can also be used to set your price objectives. Here is the price situation in relation to pivot points:
| Pivot points | S3 | S2 | S1 | PP | R1 | R2 | R3 |
|---|---|---|---|---|---|---|---|
| Standard | 5.31 | 6.65 | 7.81 | 9.15 | 10.31 | 11.65 | 12.81 |
| Camarilla | 8.27 | 8.50 | 8.73 | 8.96 | 9.19 | 9.42 | 9.65 |
| Woodie | 5.21 | 6.61 | 7.71 | 9.11 | 10.21 | 11.61 | 12.71 |
| Fibonacci | 6.65 | 7.61 | 8.20 | 9.15 | 10.11 | 10.70 | 11.65 |
| Pivot points | S3 | S2 | S1 | PP | R1 | R2 | R3 |
|---|---|---|---|---|---|---|---|
| Standard | 2.34 | 3.03 | 4.01 | 4.70 | 5.68 | 6.37 | 7.35 |
| Camarilla | 4.54 | 4.69 | 4.85 | 5.00 | 5.15 | 5.31 | 5.46 |
| Woodie | 2.50 | 3.10 | 4.17 | 4.77 | 5.84 | 6.44 | 7.51 |
| Fibonacci | 3.03 | 3.67 | 4.06 | 4.70 | 5.34 | 5.73 | 6.37 |
| Pivot points | S3 | S2 | S1 | PP | R1 | R2 | R3 |
|---|---|---|---|---|---|---|---|
| Standard | -1.39 | -0.21 | 1.40 | 2.58 | 4.19 | 5.37 | 6.98 |
| Camarilla | 2.23 | 2.49 | 2.74 | 3.00 | 3.26 | 3.51 | 3.77 |
| Woodie | -1.19 | -0.10 | 1.61 | 2.69 | 4.40 | 5.48 | 7.19 |
| Fibonacci | -0.21 | 0.86 | 1.52 | 2.58 | 3.65 | 4.31 | 5.37 |
Numerical data
The following are the details of the technical indicators and moving averages that were collected to generate this technical analysis:
| RSI (14): | 53.44 | |
| MACD (12,26,9): | 0.9400 | |
| Directional Movement: | 11.89 | |
| AROON (14): | 35.71 | |
| DEMA (21): | 9.35 | |
| Parabolic SAR (0,02-0,02-0,2): | 10.46 | |
| Elder Ray (13): | -0.10 | |
| Super Trend (3,10): | 6.62 | |
| Zig ZAG (10): | 7.78 | |
| VORTEX (21): | 1.1000 | |
| Stochastique (14,3,5): | 47.58 | |
| TEMA (21): | 9.63 | |
| Williams %R (14): | -71.25 | |
| Chande Momentum Oscillator (20): | 0.56 | |
| Repulse (5,40,3): | -25.1300 | |
| ROCnROLL: | -1 | |
| TRIX (15,9): | 2.5000 | |
| Courbe Coppock: | 54.56 |
| MA7: | 6.53 | |
| MA20: | 4.44 | |
| MA50: | 2.53 | |
| MA100: | 1.74 | |
| MAexp7: | 8.86 | |
| MAexp20: | 8.12 | |
| MAexp50: | 6.57 | |
| MAexp100: | 5.25 | |
| Price / MA7: | +2.60% | |
| Price / MA20: | +50.90% | |
| Price / MA50: | +164.82% | |
| Price / MA100: | +285.06% | |
| Price / MAexp7: | -24.38% | |
| Price / MAexp20: | -17.49% | |
| Price / MAexp50: | +1.98% | |
| Price / MAexp100: | +27.62% |
About author

Online


Add a comment
Comments
0 comments on the analysis D-WAVE QUANTUM INC. - 1H