MARATHON OIL CORP. - Daily - Technical analysis published on 02/13/2022 (GMT)
- 265
- 0
Click here for a new analysis!
- Timeframe : Daily
- - Analysis generated on
- Status : INVALID
Summary of the analysis
Additional analysis
Quotes
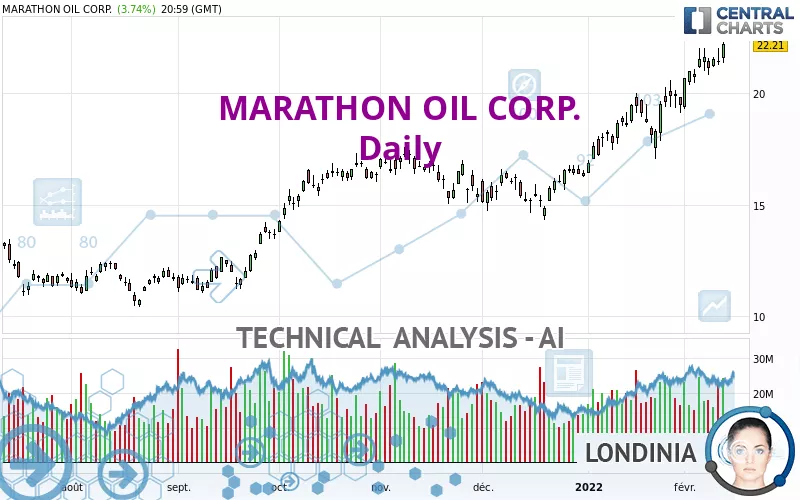
The MARATHON OIL CORP. price is 22.21 USD. The price registered an increase of +3.74% on the session and was traded between 21.36 USD and 22.28 USD over the period. The price is currently at +3.98% from its lowest and -0.31% from its highest.The Central Gaps scanner detects a bullish opening marking the presence of buyers ahead of sellers at the opening but not sufficiently marked to allow the price to register a quotation gap.
Bullish opening
Type : Bullish
Timeframe : Openning
Here is a more detailed summary of the historical variations registered by MARATHON OIL CORP.:
Near a new HIGH record (5 years)
Type : Bullish
Timeframe : Weekly
New HIGH record (1 year)
Type : Bullish
Timeframe : Weekly
New HIGH record (1st january)
Type : Bullish
Timeframe : Weekly
New HIGH record (1 month)
Type : Bullish
Timeframe : Weekly
Technical
Technical analysis of this Daily chart of MARATHON OIL CORP. indicates that the overall trend is strongly bullish. The signals given by the moving averages are 92.86% bullish. This strong bullish trend is confirmed by the strong signals currently being given by short-term moving averages. The Central Indicators market scanner is currently detecting a bullish signal that could impact this trend:
Moving Average bullish crossovers : AMA50 & AMA100
Type : Bullish
Timeframe : Daily
The probability of a further increase is high given the direction of the technical indicators.
But beware of excesses. The Central Indicators scanner currently detects this:
RSI indicator is overbought : over 70
Type : Neutral
Timeframe : Daily
CCI indicator is overbought : over 100
Type : Neutral
Timeframe : Daily
Williams %R indicator is overbought : over -20
Type : Neutral
Timeframe : Daily
Pivot points : price is over resistance 1
Type : Neutral
Timeframe : Daily
The Central Patterns scanner, which studies chart patterns, resistances and supports, has identified this signal:
Resistance of channel is broken
Type : Bullish
Timeframe : Daily
The Central Candlesticks scanner, specialised in Japanese candlesticks, did not identify any signals.
| S3 | S2 | S1 | Price | R1 | R2 | R3 | |
|---|---|---|---|---|---|---|---|
| ProTrendLines | 17.26 | 19.92 | 21.95 | 22.21 | 23.99 | 41.69 | 54.27 |
| Change (%) | -22.29% | -10.31% | -1.17% | - | +8.01% | +87.71% | +144.35% |
| Change | -4.95 | -2.29 | -0.26 | - | +1.78 | +19.48 | +32.06 |
| Level | Intermediate | Major | Intermediate | - | Intermediate | Minor | Intermediate |
Pivot points can also be used to set your price objectives. Here is the price situation in relation to pivot points:
| Pivot points | S3 | S2 | S1 | PP | R1 | R2 | R3 |
|---|---|---|---|---|---|---|---|
| Standard | 20.70 | 21.03 | 21.62 | 21.95 | 22.54 | 22.87 | 23.46 |
| Camarilla | 21.96 | 22.04 | 22.13 | 22.21 | 22.29 | 22.38 | 22.46 |
| Woodie | 20.83 | 21.10 | 21.75 | 22.02 | 22.67 | 22.94 | 23.59 |
| Fibonacci | 21.03 | 21.38 | 21.60 | 21.95 | 22.30 | 22.52 | 22.87 |
| Pivot points | S3 | S2 | S1 | PP | R1 | R2 | R3 |
|---|---|---|---|---|---|---|---|
| Standard | 19.73 | 20.26 | 21.23 | 21.76 | 22.73 | 23.26 | 24.23 |
| Camarilla | 21.80 | 21.94 | 22.07 | 22.21 | 22.35 | 22.49 | 22.62 |
| Woodie | 19.96 | 20.37 | 21.46 | 21.87 | 22.96 | 23.37 | 24.46 |
| Fibonacci | 20.26 | 20.83 | 21.18 | 21.76 | 22.33 | 22.68 | 23.26 |
| Pivot points | S3 | S2 | S1 | PP | R1 | R2 | R3 |
|---|---|---|---|---|---|---|---|
| Standard | 12.87 | 14.64 | 17.05 | 18.82 | 21.23 | 23.00 | 25.41 |
| Camarilla | 18.32 | 18.70 | 19.09 | 19.47 | 19.85 | 20.24 | 20.62 |
| Woodie | 13.20 | 14.80 | 17.38 | 18.98 | 21.56 | 23.16 | 25.74 |
| Fibonacci | 14.64 | 16.23 | 17.22 | 18.82 | 20.41 | 21.40 | 23.00 |
Numerical data
The following are the details of the technical indicators and moving averages that were collected to generate this technical analysis:
| RSI (14): | 72.48 | |
| MACD (12,26,9): | 1.1000 | |
| Directional Movement: | 19.73 | |
| AROON (14): | 100.00 | |
| DEMA (21): | 21.69 | |
| Parabolic SAR (0,02-0,02-0,2): | 20.24 | |
| Elder Ray (13): | 0.97 | |
| Super Trend (3,10): | 19.19 | |
| Zig ZAG (10): | 22.21 | |
| VORTEX (21): | 1.1300 | |
| Stochastique (14,3,5): | 92.16 | |
| TEMA (21): | 22.05 | |
| Williams %R (14): | -1.58 | |
| Chande Momentum Oscillator (20): | 2.60 | |
| Repulse (5,40,3): | 4.7400 | |
| ROCnROLL: | 1 | |
| TRIX (15,9): | 0.8000 | |
| Courbe Coppock: | 26.74 |
| MA7: | 21.46 | |
| MA20: | 20.16 | |
| MA50: | 17.95 | |
| MA100: | 16.84 | |
| MAexp7: | 21.41 | |
| MAexp20: | 20.27 | |
| MAexp50: | 18.61 | |
| MAexp100: | 17.00 | |
| Price / MA7: | +3.49% | |
| Price / MA20: | +10.17% | |
| Price / MA50: | +23.73% | |
| Price / MA100: | +31.89% | |
| Price / MAexp7: | +3.74% | |
| Price / MAexp20: | +9.57% | |
| Price / MAexp50: | +19.34% | |
| Price / MAexp100: | +30.65% |
News
Don't forget to follow the news on MARATHON OIL CORP.. At the time of publication of this analysis, the latest news was as follows:
- Marathon Oil Provides ESG Update
- Marathon Oil Corporation Declares Fourth Quarter 2021 Dividend
- Thinking about buying stock in Brickell Biotech, Zynga, 22nd Century Group, Nikola Corp, or Marathon Oil?
- Marathon Oil Schedules Fourth Quarter and Full-Year 2021 Earnings Release and Conference Call
- Marathon Oil Reports Third Quarter 2021 Results
About author

Online


Add a comment
Comments
0 comments on the analysis MARATHON OIL CORP. - Daily