LULULEMON ATHLETICA INC. - Daily - Technical analysis published on 11/23/2023 (GMT)
- 187
- 0
Click here for a new analysis!
- Timeframe : Daily
- - Analysis generated on
- Status : TARGET REACHED
Summary of the analysis

Additional analysis
Quotes
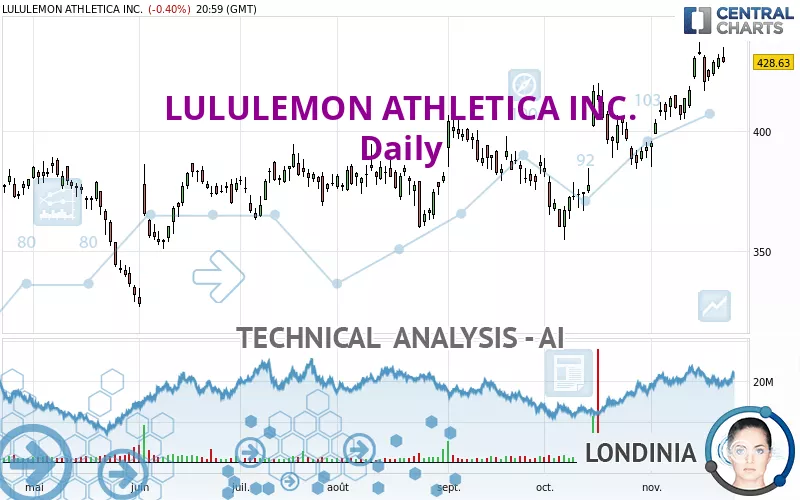
The LULULEMON ATHLETICA INC. price is 428.63 USD. On the day, this instrument lost -0.40% and was between 428.27 USD and 435.07 USD. This implies that the price is at +0.08% from its lowest and at -1.48% from its highest.The Central Gaps scanner detects a bullish opening. A small advantage for buyers in the very short term.
Bullish opening
Type : Bullish
Timeframe : Openning
A study of price movements over other periods shows the following variations:
Near a new HIGH record (1 year)
Type : Bullish
Timeframe : Weekly
Near a new HIGH record (1st january)
Type : Bullish
Timeframe : Weekly
Near a new HIGH record (1 month)
Type : Bullish
Timeframe : Weekly
Technical
A technical analysis in Daily of this LULULEMON ATHLETICA INC. chart shows a strongly bullish trend. The signals given by the moving averages are 92.86% bullish. This strong bullish trend is confirmed by the strong signals currently being given by short-term moving averages. The Central Indicators scanner does not detect any result on moving averages that would impact this trend.
An assessment of technical indicators shows a moderate bullish signal.
But beware of excesses. The Central Indicators scanner currently detects this:
CCI indicator is overbought : over 100
Type : Neutral
Timeframe : Daily
Price is back under the pivot point
Type : Bearish
Timeframe : Daily
The Central Patterns scanner, which studies chart patterns, resistances and supports, has identified this signal:
Near horizontal resistance
Type : Bearish
Timeframe : Daily
The Central Candlesticks scanner, specialised in Japanese candlesticks, did not identify any signals.
| S3 | S2 | S1 | Price | R1 | R2 | |
|---|---|---|---|---|---|---|
| ProTrendLines | 360.29 | 386.25 | 398.29 | 428.63 | 432.61 | 477.91 |
| Change (%) | -15.94% | -9.89% | -7.08% | - | +0.93% | +11.50% |
| Change | -68.34 | -42.38 | -30.34 | - | +3.98 | +49.28 |
| Level | Intermediate | Major | Intermediate | - | Major | Major |
Attention could also be paid to pivot points to set price objectives:
| Pivot points | S3 | S2 | S1 | PP | R1 | R2 | R3 |
|---|---|---|---|---|---|---|---|
| Standard | 419.44 | 423.86 | 426.24 | 430.66 | 433.04 | 437.46 | 439.84 |
| Camarilla | 426.76 | 427.38 | 428.01 | 428.63 | 429.25 | 429.88 | 430.50 |
| Woodie | 418.43 | 423.35 | 425.23 | 430.15 | 432.03 | 436.95 | 438.83 |
| Fibonacci | 423.86 | 426.45 | 428.06 | 430.66 | 433.25 | 434.86 | 437.46 |
| Pivot points | S3 | S2 | S1 | PP | R1 | R2 | R3 |
|---|---|---|---|---|---|---|---|
| Standard | 381.89 | 395.85 | 409.14 | 423.10 | 436.39 | 450.35 | 463.64 |
| Camarilla | 414.95 | 417.44 | 419.94 | 422.44 | 424.94 | 427.44 | 429.93 |
| Woodie | 381.57 | 395.68 | 408.82 | 422.93 | 436.07 | 450.18 | 463.32 |
| Fibonacci | 395.85 | 406.26 | 412.69 | 423.10 | 433.51 | 439.94 | 450.35 |
| Pivot points | S3 | S2 | S1 | PP | R1 | R2 | R3 |
|---|---|---|---|---|---|---|---|
| Standard | 293.61 | 324.13 | 358.81 | 389.33 | 424.01 | 454.53 | 489.21 |
| Camarilla | 375.55 | 381.53 | 387.50 | 393.48 | 399.46 | 405.43 | 411.41 |
| Woodie | 295.68 | 325.17 | 360.88 | 390.37 | 426.08 | 455.57 | 491.28 |
| Fibonacci | 324.13 | 349.04 | 364.43 | 389.33 | 414.24 | 429.63 | 454.53 |
Numerical data
The following are the details of the technical indicators and moving averages that were collected to generate this technical analysis:
| RSI (14): | 63.93 | |
| MACD (12,26,9): | 9.8700 | |
| Directional Movement: | 13.79 | |
| AROON (14): | 64.29 | |
| DEMA (21): | 427.35 | |
| Parabolic SAR (0,02-0,02-0,2): | 400.86 | |
| Elder Ray (13): | 11.46 | |
| Super Trend (3,10): | 406.82 | |
| Zig ZAG (10): | 428.63 | |
| VORTEX (21): | 1.1000 | |
| Stochastique (14,3,5): | 80.12 | |
| TEMA (21): | 431.80 | |
| Williams %R (14): | -25.88 | |
| Chande Momentum Oscillator (20): | 20.68 | |
| Repulse (5,40,3): | -0.4300 | |
| ROCnROLL: | 1 | |
| TRIX (15,9): | 0.3200 | |
| Courbe Coppock: | 13.69 |
| MA7: | 427.55 | |
| MA20: | 411.44 | |
| MA50: | 395.93 | |
| MA100: | 388.68 | |
| MAexp7: | 425.46 | |
| MAexp20: | 414.88 | |
| MAexp50: | 401.57 | |
| MAexp100: | 390.11 | |
| Price / MA7: | +0.25% | |
| Price / MA20: | +4.18% | |
| Price / MA50: | +8.26% | |
| Price / MA100: | +10.28% | |
| Price / MAexp7: | +0.75% | |
| Price / MAexp20: | +3.31% | |
| Price / MAexp50: | +6.74% | |
| Price / MAexp100: | +9.87% |
News
Don't forget to follow the news on LULULEMON ATHLETICA INC.. At the time of publication of this analysis, the latest news was as follows:
- Lululemon Athletica & Hubbell Set to Join S&P 500; Others to Join S&P MidCap 400 and S&P SmallCap 600
- lululemon athletica inc. Announces Second Quarter Fiscal 2023 Earnings Conference Call
- lululemon Announces the Formation of Mental Wellbeing Global Advisory Board
- Thinking about buying stock in Lululemon Athletica, Starbucks, Polestar Automotive Holding, WiSA Technologies, or Blue Water Biotech?
- lululemon athletica inc. Announces First Quarter Fiscal 2023 Results
About author

Online


Add a comment
Comments
0 comments on the analysis LULULEMON ATHLETICA INC. - Daily