ARCH CAPITAL GROUP - 1H - Technical analysis published on 08/14/2024 (GMT)
- 162
- 0
Click here for a new analysis!
- Timeframe : 1H
- - Analysis generated on
- Status : TARGET REACHED

Summary of the analysis

Additional analysis
Quotes
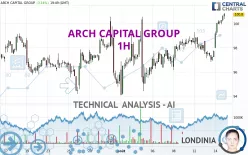
The ARCH CAPITAL GROUP rating is 100.82 USD. On the day, this instrument gained +3.16% with the lowest point at 97.99 USD and the highest point at 100.87 USD. The deviation from the price is +2.89% for the low point and -0.05% for the high point.The Central Gaps scanner detects a bullish opening. A small advantage for buyers in the very short term.
Bullish opening
Type : Bullish
Timeframe : Openning
Here is a more detailed summary of the historical variations registered by ARCH CAPITAL GROUP:
Near a new HIGH record (5 years)
Type : Bullish
Timeframe : Weekly
Near a new HIGH record (1 year)
Type : Bullish
Timeframe : Weekly
Near a new HIGH record (1st january)
Type : Bullish
Timeframe : Weekly
New HIGH record (1 month)
Type : Bullish
Timeframe : Weekly
Technical
Technical analysis of this 1H chart of ARCH CAPITAL GROUP indicates that the overall trend is strongly bullish. 92.86% of the signals given by moving averages are bullish. This strongly bullish trend is supported by the strong bullish signals given by short-term moving averages. There is no crossing of moving average by the price or crossing of moving averages between themselves.
In fact, 14 technical indicators on 18 studied are currently positioned bullish. Caution: the Central Indicators scanner currently detects an excess:
RSI indicator is overbought : over 70
Type : Neutral
Timeframe : 1 hour
CCI indicator is overbought : over 100
Type : Neutral
Timeframe : 1 hour
Williams %R indicator is overbought : over -20
Type : Neutral
Timeframe : 1 hour
Pivot points : price is over resistance 3
Type : Neutral
Timeframe : 1 hour
The Central Patterns scanner, which studies chart patterns, resistances and supports, has identified these signals:
Near horizontal resistance
Type : Bearish
Timeframe : 1 hour
Resistance of channel is broken
Type : Bullish
Timeframe : 1 hour
The presence of a bearish pattern in Japanese candlesticks detected by Central Candlesticks that could cause a correction in the very short term was also detected:
Bearish harami
Type : Bearish
Timeframe : 1 hour
| S3 | S2 | S1 | Price | R1 | |
|---|---|---|---|---|---|
| ProTrendLines | 98.67 | 99.29 | 100.57 | 100.82 | 103.36 |
| Change (%) | -2.13% | -1.52% | -0.25% | - | +2.52% |
| Change | -2.15 | -1.53 | -0.25 | - | +2.54 |
| Level | Intermediate | Minor | Major | - | Major |
Attention could also be paid to pivot points to set price objectives:
| Pivot points | S3 | S2 | S1 | PP | R1 | R2 | R3 |
|---|---|---|---|---|---|---|---|
| Standard | 95.09 | 95.95 | 96.84 | 97.70 | 98.59 | 99.45 | 100.34 |
| Camarilla | 97.25 | 97.41 | 97.57 | 97.73 | 97.89 | 98.05 | 98.21 |
| Woodie | 95.11 | 95.96 | 96.86 | 97.71 | 98.61 | 99.46 | 100.36 |
| Fibonacci | 95.95 | 96.62 | 97.03 | 97.70 | 98.37 | 98.78 | 99.45 |
| Pivot points | S3 | S2 | S1 | PP | R1 | R2 | R3 |
|---|---|---|---|---|---|---|---|
| Standard | 89.12 | 91.76 | 95.28 | 97.92 | 101.44 | 104.08 | 107.60 |
| Camarilla | 97.10 | 97.66 | 98.23 | 98.79 | 99.36 | 99.92 | 100.48 |
| Woodie | 89.55 | 91.98 | 95.71 | 98.14 | 101.87 | 104.30 | 108.03 |
| Fibonacci | 91.76 | 94.12 | 95.57 | 97.92 | 100.28 | 101.73 | 104.08 |
| Pivot points | S3 | S2 | S1 | PP | R1 | R2 | R3 |
|---|---|---|---|---|---|---|---|
| Standard | 84.35 | 89.26 | 92.52 | 97.43 | 100.69 | 105.60 | 108.86 |
| Camarilla | 93.53 | 94.28 | 95.03 | 95.78 | 96.53 | 97.28 | 98.03 |
| Woodie | 83.53 | 88.85 | 91.70 | 97.02 | 99.87 | 105.19 | 108.04 |
| Fibonacci | 89.26 | 92.38 | 94.31 | 97.43 | 100.55 | 102.48 | 105.60 |
Numerical data
The following is the status of technical indicators and moving averages registered at the time this technical analysis was created:
| RSI (14): | 70.30 | |
| MACD (12,26,9): | 0.6700 | |
| Directional Movement: | 26.51 | |
| AROON (14): | 57.15 | |
| DEMA (21): | 99.75 | |
| Parabolic SAR (0,02-0,02-0,2): | 97.91 | |
| Elder Ray (13): | 1.15 | |
| Super Trend (3,10): | 98.84 | |
| Zig ZAG (10): | 100.46 | |
| VORTEX (21): | 1.1200 | |
| Stochastique (14,3,5): | 98.07 | |
| TEMA (21): | 100.18 | |
| Williams %R (14): | -4.40 | |
| Chande Momentum Oscillator (20): | 3.02 | |
| Repulse (5,40,3): | 0.7800 | |
| ROCnROLL: | 1 | |
| TRIX (15,9): | 0.0500 | |
| Courbe Coppock: | 3.82 |
| MA7: | 98.12 | |
| MA20: | 97.23 | |
| MA50: | 98.56 | |
| MA100: | 97.03 | |
| MAexp7: | 99.95 | |
| MAexp20: | 99.00 | |
| MAexp50: | 98.25 | |
| MAexp100: | 97.86 | |
| Price / MA7: | +2.75% | |
| Price / MA20: | +3.69% | |
| Price / MA50: | +2.29% | |
| Price / MA100: | +3.91% | |
| Price / MAexp7: | +0.87% | |
| Price / MAexp20: | +1.84% | |
| Price / MAexp50: | +2.62% | |
| Price / MAexp100: | +3.02% |
About author
Online


Add a comment
Comments
0 comments on the analysis ARCH CAPITAL GROUP - 1H