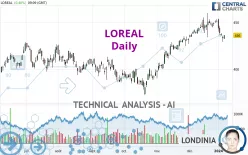
LOREAL - Daily - Technical analysis published on 01/08/2024 (GMT)
- 174
- 0
Click here for a new analysis!
- Timeframe : Daily
- - Analysis generated on
- Status : INVALID

Summary of the analysis

Additional analysis
Quotes
The LOREAL price is 436.00 EUR. On the day, this instrument gained +0.40% with the lowest point at 432.30 EUR and the highest point at 436.40 EUR. The deviation from the price is +0.86% for the low point and -0.09% for the high point.So that you have an overall view of the price change, here is a table showing the variations over several periods:
Near a new HIGH record (1st january)
Type : Bullish
Timeframe : Weekly
Near a new LOW record (1 month)
Type : Bearish
Timeframe : Weekly
Technical
Technical analysis of this Daily chart of LOREAL indicates that the overall trend is bullish. 71.43% of the signals given by moving averages are bullish. Caution: the neutral signals currently given by short-term moving averages show us that the global trend is losing momentum. The Central Indicators market scanner is currently detecting a bearish signal that could impact this trend:
Bearish trend reversal : Moving Average 20
Type : Bearish
Timeframe : Daily
An assessment of technical indicators shows a bearish signal.
But beware of excesses. The Central Indicators scanner currently detects this:
CCI indicator is oversold : under -100
Type : Neutral
Timeframe : Daily
Previous candle closed under Bollinger bands
Type : Neutral
Timeframe : Daily
Price is back over the pivot point
Type : Bullish
Timeframe : Daily
An analysis of the price chart with the Central Patterns scanner (detector of chart patterns and resistances and supports) shows several results that can have an impact on the price change:
Near horizontal support
Type : Bullish
Timeframe : Daily
Support of channel is broken
Type : Bearish
Timeframe : Daily
No result was found by the Central Candlesticks scanner on Japanese candlesticks.
| S3 | S2 | S1 | Price | R1 | R2 | R3 | |
|---|---|---|---|---|---|---|---|
| ProTrendLines | 397.75 | 410.05 | 427.10 | 436.00 | 436.46 | 443.55 | 451.12 |
| Change (%) | -8.77% | -5.95% | -2.04% | - | +0.11% | +1.73% | +3.47% |
| Change | -38.25 | -25.95 | -8.90 | - | +0.46 | +7.55 | +15.12 |
| Level | Intermediate | Minor | Intermediate | - | Major | Intermediate | Intermediate |
Attention could also be paid to pivot points to set price objectives:
| Pivot points | S3 | S2 | S1 | PP | R1 | R2 | R3 |
|---|---|---|---|---|---|---|---|
| Standard | 423.97 | 426.58 | 430.42 | 433.03 | 436.87 | 439.48 | 443.32 |
| Camarilla | 432.48 | 433.07 | 433.66 | 434.25 | 434.84 | 435.43 | 436.02 |
| Woodie | 424.58 | 426.89 | 431.03 | 433.34 | 437.48 | 439.79 | 443.93 |
| Fibonacci | 426.58 | 429.05 | 430.57 | 433.03 | 435.50 | 437.02 | 439.48 |
| Pivot points | S3 | S2 | S1 | PP | R1 | R2 | R3 |
|---|---|---|---|---|---|---|---|
| Standard | 399.43 | 414.32 | 424.28 | 439.17 | 449.13 | 464.02 | 473.98 |
| Camarilla | 427.42 | 429.69 | 431.97 | 434.25 | 436.53 | 438.81 | 441.08 |
| Woodie | 396.98 | 413.09 | 421.83 | 437.94 | 446.68 | 462.79 | 471.53 |
| Fibonacci | 414.32 | 423.81 | 429.67 | 439.17 | 448.66 | 454.52 | 464.02 |
| Pivot points | S3 | S2 | S1 | PP | R1 | R2 | R3 |
|---|---|---|---|---|---|---|---|
| Standard | 409.85 | 421.75 | 436.20 | 448.10 | 462.55 | 474.45 | 488.90 |
| Camarilla | 443.40 | 445.82 | 448.24 | 450.65 | 453.07 | 455.48 | 457.90 |
| Woodie | 411.13 | 422.39 | 437.48 | 448.74 | 463.83 | 475.09 | 490.18 |
| Fibonacci | 421.75 | 431.82 | 438.03 | 448.10 | 458.17 | 464.38 | 474.45 |
Numerical data
The following is the status of the technical indicators and moving averages at the time of publication of this technical analysis:
| RSI (14): | 43.87 | |
| MACD (12,26,9): | 2.2500 | |
| Directional Movement: | -3.59 | |
| AROON (14): | -71.43 | |
| DEMA (21): | 445.72 | |
| Parabolic SAR (0,02-0,02-0,2): | 456.81 | |
| Elder Ray (13): | -7.30 | |
| Super Trend (3,10): | 433.44 | |
| Zig ZAG (10): | 435.35 | |
| VORTEX (21): | 0.9300 | |
| Stochastique (14,3,5): | 16.14 | |
| TEMA (21): | 441.12 | |
| Williams %R (14): | -79.55 | |
| Chande Momentum Oscillator (20): | -11.95 | |
| Repulse (5,40,3): | 0.4200 | |
| ROCnROLL: | -1 | |
| TRIX (15,9): | 0.1800 | |
| Courbe Coppock: | 1.55 |
| MA7: | 441.70 | |
| MA20: | 444.41 | |
| MA50: | 428.96 | |
| MA100: | 412.99 | |
| MAexp7: | 439.81 | |
| MAexp20: | 440.97 | |
| MAexp50: | 431.11 | |
| MAexp100: | 420.63 | |
| Price / MA7: | -1.29% | |
| Price / MA20: | -1.89% | |
| Price / MA50: | +1.64% | |
| Price / MA100: | +5.57% | |
| Price / MAexp7: | -0.87% | |
| Price / MAexp20: | -1.13% | |
| Price / MAexp50: | +1.13% | |
| Price / MAexp100: | +3.65% |
News
The latest news and videos published on LOREAL at the time of the analysis were as follows:
- Disclosure of total number of voting rights and number of shares in the capital at November 30, 2023
- Disclosure of total number of voting rights and number of shares in the capital at August 31, 2023
- 2023 Half-Year Results
- L’Oréal successfully prices a 2 Billion euro dual tranche bond
- L’Oréal Fund for Nature Regeneration accelerates biodiversity preservation efforts with three new investments
About author
Online


Add a comment
Comments
0 comments on the analysis LOREAL - Daily