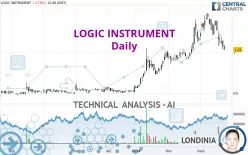
LOGIC INSTRUMENT - Daily - Technical analysis published on 03/25/2024 (GMT)
- 105
- 0
Click here for a new analysis!
- Timeframe : Daily
- - Analysis generated on
- Status : INVALID

Summary of the analysis

Additional analysis
Quotes
The LOGIC INSTRUMENT rating is 1.030 EUR. The price is lower by -3.74% since the last closing and was traded between 1.030 EUR and 1.080 EUR over the period. The price is currently at 0% from its lowest and -4.63% from its highest.The Central Gaps scanner detects a bullish opening. A small advantage for buyers in the very short term.
Bullish opening
Type : Bullish
Timeframe : Openning
So that you have an overall view of the price change, here is a table showing the variations over several periods:
Near a new LOW record (1 month)
Type : Bearish
Timeframe : Weekly
The Central Volumes scanner notes the presence of abnormal volumes:
Abnormal volumes
Timeframe : 5 days
Abnormal volumes
Timeframe : 20 days
Technical
A technical analysis in Daily of this LOGIC INSTRUMENT chart shows a slightly bullish trend. 57.14% of the signals given by moving averages are bullish. Caution: the strong bearish signals currently given by short-term moving averages indicate that a trend reversal may be taking place. An assessment of moving averages reveals several bearish signals that could impact this trend:
Bearish trend reversal : Moving Average 20
Type : Bearish
Timeframe : Daily
Bearish price crossover with Moving Average 50
Type : Bearish
Timeframe : Daily
Technical indicators are bearish. There is still some doubt about the decline in the price.
Caution: the Central Indicators scanner currently detects an excess:
CCI indicator is oversold : under -100
Type : Neutral
Timeframe : Daily
Williams %R indicator is oversold : under -80
Type : Neutral
Timeframe : Daily
The Central Patterns scanner, which studies chart patterns, resistances and supports, has identified this signal:
Support of channel is broken
Type : Bearish
Timeframe : Daily
The Central Candlesticks scanner which studies Japanese candlesticks did not detect anything.
| S3 | S2 | S1 | Price | R1 | R2 | R3 | |
|---|---|---|---|---|---|---|---|
| ProTrendLines | 0.619 | 0.732 | 0.919 | 1.030 | 1.230 | 1.430 | 2.790 |
| Change (%) | -39.90% | -28.93% | -10.78% | - | +19.42% | +38.83% | +170.87% |
| Change | -0.411 | -0.298 | -0.111 | - | +0.200 | +0.400 | +1.760 |
| Level | Major | Minor | Intermediate | - | Major | Major | Intermediate |
Pivot points can also be used to set your price objectives. Here is the price situation in relation to pivot points:
| Pivot points | S3 | S2 | S1 | PP | R1 | R2 | R3 |
|---|---|---|---|---|---|---|---|
| Standard | 0.918 | 0.977 | 1.023 | 1.082 | 1.128 | 1.187 | 1.233 |
| Camarilla | 1.041 | 1.051 | 1.060 | 1.070 | 1.080 | 1.089 | 1.099 |
| Woodie | 0.913 | 0.974 | 1.018 | 1.079 | 1.123 | 1.184 | 1.228 |
| Fibonacci | 0.977 | 1.017 | 1.042 | 1.082 | 1.122 | 1.147 | 1.187 |
| Pivot points | S3 | S2 | S1 | PP | R1 | R2 | R3 |
|---|---|---|---|---|---|---|---|
| Standard | 0.598 | 0.817 | 0.943 | 1.162 | 1.288 | 1.507 | 1.633 |
| Camarilla | 0.975 | 1.007 | 1.038 | 1.070 | 1.102 | 1.133 | 1.165 |
| Woodie | 0.553 | 0.794 | 0.898 | 1.139 | 1.243 | 1.484 | 1.588 |
| Fibonacci | 0.817 | 0.949 | 1.030 | 1.162 | 1.294 | 1.375 | 1.507 |
| Pivot points | S3 | S2 | S1 | PP | R1 | R2 | R3 |
|---|---|---|---|---|---|---|---|
| Standard | 0.343 | 0.600 | 0.887 | 1.144 | 1.431 | 1.688 | 1.975 |
| Camarilla | 1.025 | 1.075 | 1.125 | 1.175 | 1.225 | 1.275 | 1.325 |
| Woodie | 0.359 | 0.608 | 0.903 | 1.152 | 1.447 | 1.696 | 1.991 |
| Fibonacci | 0.600 | 0.808 | 0.936 | 1.144 | 1.352 | 1.480 | 1.688 |
Numerical data
The following is the status of technical indicators and moving averages registered at the time this technical analysis was created:
| RSI (14): | 40.87 | |
| MACD (12,26,9): | 0.0160 | |
| Directional Movement: | -8.523 | |
| AROON (14): | -78.571 | |
| DEMA (21): | 1.238 | |
| Parabolic SAR (0,02-0,02-0,2): | 1.343 | |
| Elder Ray (13): | -0.136 | |
| Super Trend (3,10): | 1.369 | |
| Zig ZAG (10): | 1.050 | |
| VORTEX (21): | 0.9720 | |
| Stochastique (14,3,5): | 9.09 | |
| TEMA (21): | 1.171 | |
| Williams %R (14): | -100.00 | |
| Chande Momentum Oscillator (20): | -0.370 | |
| Repulse (5,40,3): | -11.1240 | |
| ROCnROLL: | -1 | |
| TRIX (15,9): | 0.8900 | |
| Courbe Coppock: | 17.58 |
| MA7: | 1.171 | |
| MA20: | 1.259 | |
| MA50: | 1.060 | |
| MA100: | 0.819 | |
| MAexp7: | 1.144 | |
| MAexp20: | 1.190 | |
| MAexp50: | 1.068 | |
| MAexp100: | 0.901 | |
| Price / MA7: | -12.04% | |
| Price / MA20: | -18.19% | |
| Price / MA50: | -2.83% | |
| Price / MA100: | +25.76% | |
| Price / MAexp7: | -9.97% | |
| Price / MAexp20: | -13.45% | |
| Price / MAexp50: | -3.56% | |
| Price / MAexp100: | +14.32% |
News
The last news published on LOGIC INSTRUMENT at the time of the generation of this analysis was as follows:
About author

Online


Add a comment
Comments
0 comments on the analysis LOGIC INSTRUMENT - Daily