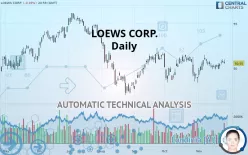
LOEWS CORP. - Daily - Technical analysis published on 11/26/2019 (GMT)
- 275
- 0
- Who voted?
Click here for a new analysis!
- Timeframe : Daily
- - Analysis generated on
- Status : INVALID

Summary of the analysis

Additional analysis
Quotes
The LOEWS CORP. rating is 50.55 USD. The price is lower by -0.49% since the last closing and was traded between 50.51 USD and 50.98 USD over the period. The price is currently at +0.08% from its lowest and -0.84% from its highest.The Central Gaps scanner detects a bearish opening. A small advantage for sellers in the very short term.
Bearish opening
Type : Bearish
Timeframe : Openning
Here is a more detailed summary of the historical variations registered by LOEWS CORP.:
Technical
A technical analysis in Daily of this LOEWS CORP. chart shows a slightly bullish trend. 46.43% of the signals given by moving averages are bullish. The overall trend remains fragile, as do the slightly bullish signals given by short-term moving averages. An assessment of moving averages reveals several bullish signals that could impact this trend:
Bullish trend reversal : Moving Average 20
Type : Bullish
Timeframe : Daily
Bullish price crossover with adaptative moving average 20
Type : Bullish
Timeframe : Daily
The technical indicators are bullish. There is still some doubt about the price increase.
But beware of excesses. The Central Indicators scanner currently detects this:
CCI indicator is overbought : over 100
Type : Neutral
Timeframe : Daily
Williams %R indicator is overbought : over -20
Type : Neutral
Timeframe : Daily
Pivot points : price is under support 1
Type : Neutral
Timeframe : Daily
Price is back over the pivot point
Type : Bullish
Timeframe : Weekly
Williams %R indicator is back over -50
Type : Bullish
Timeframe : Daily
An analysis of the price chart with the Central Patterns scanner (detector of chart patterns and resistances and supports) shows a result that can have an impact on the price change:
Resistance of triangle is broken
Type : Bullish
Timeframe : Daily
The Central Candlesticks scanner, specialised in Japanese candlesticks, did not identify any signals.
| S3 | S2 | S1 | Price | R1 | R2 | R3 | |
|---|---|---|---|---|---|---|---|
| ProTrendLines | 47.24 | 49.20 | 50.11 | 50.55 | 51.65 | 53.46 | 54.84 |
| Change (%) | -6.55% | -2.67% | -0.87% | - | +2.18% | +5.76% | +8.49% |
| Change | -3.31 | -1.35 | -0.44 | - | +1.10 | +2.91 | +4.29 |
| Level | Minor | Major | Intermediate | - | Major | Major | Minor |
To determine price objectives, it is also possible to use the pivot points. Here is the price position in relation to pivot points:
| Pivot points | S3 | S2 | S1 | PP | R1 | R2 | R3 |
|---|---|---|---|---|---|---|---|
| Standard | 50.29 | 50.47 | 50.64 | 50.82 | 50.99 | 51.17 | 51.34 |
| Camarilla | 50.70 | 50.74 | 50.77 | 50.80 | 50.83 | 50.86 | 50.90 |
| Woodie | 50.28 | 50.47 | 50.63 | 50.82 | 50.98 | 51.17 | 51.33 |
| Fibonacci | 50.47 | 50.61 | 50.69 | 50.82 | 50.96 | 51.04 | 51.17 |
| Pivot points | S3 | S2 | S1 | PP | R1 | R2 | R3 |
|---|---|---|---|---|---|---|---|
| Standard | 48.93 | 49.36 | 49.97 | 50.40 | 51.01 | 51.44 | 52.05 |
| Camarilla | 50.30 | 50.39 | 50.49 | 50.58 | 50.68 | 50.77 | 50.87 |
| Woodie | 49.02 | 49.41 | 50.06 | 50.45 | 51.10 | 51.48 | 52.14 |
| Fibonacci | 49.36 | 49.76 | 50.00 | 50.40 | 50.80 | 51.04 | 51.44 |
| Pivot points | S3 | S2 | S1 | PP | R1 | R2 | R3 |
|---|---|---|---|---|---|---|---|
| Standard | 44.32 | 46.31 | 47.62 | 49.62 | 50.93 | 52.92 | 54.23 |
| Camarilla | 48.02 | 48.33 | 48.63 | 48.93 | 49.24 | 49.54 | 49.84 |
| Woodie | 43.97 | 46.14 | 47.28 | 49.44 | 50.59 | 52.75 | 53.89 |
| Fibonacci | 46.31 | 47.57 | 48.35 | 49.62 | 50.88 | 51.66 | 52.92 |
Numerical data
The following are the details of the technical indicators and moving averages that were collected to generate this technical analysis:
| RSI (14): | 53.03 | |
| MACD (12,26,9): | 0.0800 | |
| Directional Movement: | -0.91 | |
| AROON (14): | -50.00 | |
| DEMA (21): | 50.45 | |
| Parabolic SAR (0,02-0,02-0,2): | 49.62 | |
| Elder Ray (13): | 0.34 | |
| Super Trend (3,10): | 51.03 | |
| Zig ZAG (10): | 50.55 | |
| VORTEX (21): | 1.0700 | |
| Stochastique (14,3,5): | 52.86 | |
| TEMA (21): | 50.51 | |
| Williams %R (14): | -53.39 | |
| Chande Momentum Oscillator (20): | -0.38 | |
| Repulse (5,40,3): | -0.2300 | |
| ROCnROLL: | 1 | |
| TRIX (15,9): | 0.0100 | |
| Courbe Coppock: | 1.18 |
| MA7: | 50.41 | |
| MA20: | 50.25 | |
| MA50: | 50.37 | |
| MA100: | 50.76 | |
| MAexp7: | 50.48 | |
| MAexp20: | 50.36 | |
| MAexp50: | 50.36 | |
| MAexp100: | 50.48 | |
| Price / MA7: | +0.28% | |
| Price / MA20: | +0.60% | |
| Price / MA50: | +0.36% | |
| Price / MA100: | -0.41% | |
| Price / MAexp7: | +0.14% | |
| Price / MAexp20: | +0.38% | |
| Price / MAexp50: | +0.38% | |
| Price / MAexp100: | +0.14% |
News
The latest news and videos published on LOEWS CORP. at the time of the analysis were as follows:
- Loews Corporation Announces Quarterly Dividend On Common Stock
- Loews Corporation Reports Net Income Of $72 Million For The Third Quarter Of 2019
- Loews Corporation to Release Third Quarter 2019 Results on October 28, 2019
- Live! By Loews - Arlington, TX Officially Opens Its Doors
- Loews Corporation Announces Quarterly Dividend On Common Stock
About author

Online


Add a comment
Comments
0 comments on the analysis LOEWS CORP. - Daily