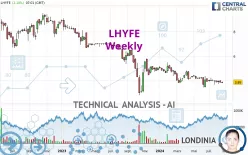
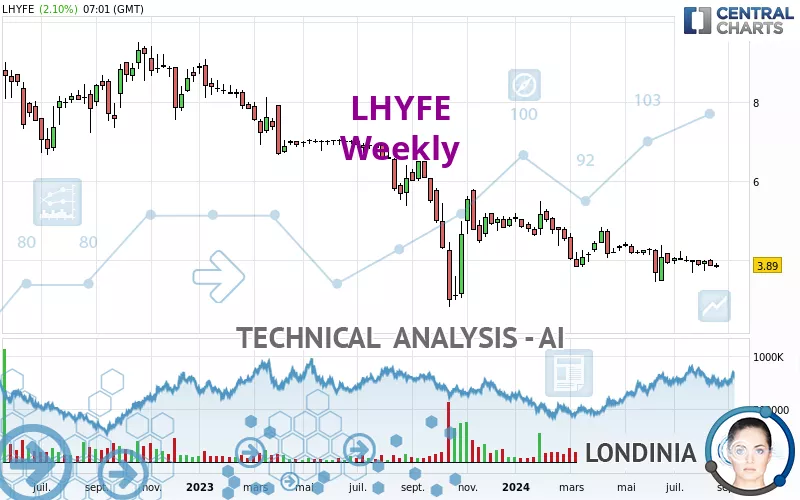
LHYFE - Weekly - Technical analysis published on 08/21/2024 (GMT)
- 119
- 0
I am delighted to see that my first price objective has been achieved. I hope you've taken advantage of it.
Click here for a new analysis!
Click here for a new analysis!
- Timeframe : Weekly
- - Analysis generated on
- Status : TARGET REACHED
Summary of the analysis
Trends
Short term:
Strongly bearish
Underlying:
Strongly bearish
Technical indicators
22%
50%
28%
My opinion
Bearish under 4.195 EUR
My targets
3.595 EUR (-7.58%)
2.830 EUR (-27.25%)
My analysis
The bearish trend is currently very strong for LHYFE. As long as the price remains below the resistance at 4.195 EUR, you could try to take advantage of the bearish rally. The first bearish objective is located at 3.595 EUR. The bearish momentum would be revived by a break in this support. Sellers would then use the next support located at 2.830 EUR as an objective. Be careful, given the powerful bearish rally underway, excesses could lead to a short-term rebound. If this is the case, remember that trading against the trend may be riskier. It would seem more appropriate to wait for a signal indicating reversal of the trend.
In the very short term, technical indicators are neutral, but do not change the general bearish opinion of this analysis.
Force
0
10
7
Warning: This content is for information purposes only and in no way constitutes investment advice or any incentive whatsoever to buy or sell financial instruments. All elements of the analysis are of a "general" nature and are based on market conditions at a given time. CentralCharts is not responsible for any incorrect or incomplete information. Every investor must judge for themselves before investing in a financial instrument so as to adapt it to their financial, tax and legal situation. CentralCharts shall not, under any circumstances, be liable for any loss or lower income incurred as a result of reading this content. Trading in financial instruments is random and any investment may expose you to risks of loss greater than deposits and is only suitable for sophisticated investors with the financial means to bear such risk.

This analysis was given by pierrott. Take part yourself by sharing additional analysis on another time unit:
Additional analysis
Quotes
The LHYFE rating is 3.890 EUR. Over 5 days, this instrument lost -0.51% and was traded between 3.810 EUR and 3.930 EUR over the period. The price is currently at +2.10% from its lowest point and -1.02% from its highest point.3.810
3.930
3.890
A bullish opening was detected by the Central Gaps scanner. Buyers are trying to impose a bullish momentum in the very short term.
Bullish opening
Type : Bullish
Timeframe : Openning
So that you have an overall view of the price change, here is a table showing the variations over several periods:
Near a new LOW record (1 month)
Type : Bearish
Timeframe : Weekly
Technical
Technical analysis of this Weekly chart of LHYFE indicates that the overall trend is strongly bearish. 92.86% of the signals given by moving averages are bearish. This strongly bearish trend is supported by the strong bearish signals given by short-term moving averages. The Central Indicators scanner does not detect any result on moving averages that would impact this trend.
An assessment of technical indicators does not currently provide any relevant information on the direction of future price movements.
The Central Indicators scanner found no further results concerning independent technical indicators.
Central Patterns, the market scanner focusing on chart patterns, resistances and supports found these results:
Near resistance of channel
Type : Bearish
Timeframe : Weekly
Near resistance of triangle
Type : Bearish
Timeframe : Weekly
Central Candlesticks, the scanner specialised in Japanese candlesticks, detects this inversion signal that could impact the current short-term trend:
Black hanging man / hammer
Type : Neutral
Timeframe : Weekly
ProTrendLines
S2
S1
R1
R2
R3
Price
| S2 | S1 | Price | R1 | R2 | R3 | |
|---|---|---|---|---|---|---|
| ProTrendLines | 2.830 | 3.595 | 3.890 | 4.790 | 6.686 | 7.539 |
| Change (%) | -27.25% | -7.58% | - | +23.14% | +71.88% | +93.80% |
| Change | -1.060 | -0.295 | - | +0.900 | +2.796 | +3.649 |
| Level | Minor | Intermediate | - | Major | Intermediate | Minor |
To determine price objectives, it is also possible to use the pivot points. Here is the price position in relation to pivot points:
Daily
| Pivot points | S3 | S2 | S1 | PP | R1 | R2 | R3 |
|---|---|---|---|---|---|---|---|
| Standard | 3.650 | 3.730 | 3.770 | 3.850 | 3.890 | 3.970 | 4.010 |
| Camarilla | 3.777 | 3.788 | 3.799 | 3.810 | 3.821 | 3.832 | 3.843 |
| Woodie | 3.630 | 3.720 | 3.750 | 3.840 | 3.870 | 3.960 | 3.990 |
| Fibonacci | 3.730 | 3.776 | 3.804 | 3.850 | 3.896 | 3.924 | 3.970 |
Weekly
| Pivot points | S3 | S2 | S1 | PP | R1 | R2 | R3 |
|---|---|---|---|---|---|---|---|
| Standard | 3.597 | 3.723 | 3.787 | 3.913 | 3.977 | 4.103 | 4.167 |
| Camarilla | 3.798 | 3.815 | 3.833 | 3.850 | 3.867 | 3.885 | 3.902 |
| Woodie | 3.565 | 3.708 | 3.755 | 3.898 | 3.945 | 4.088 | 4.135 |
| Fibonacci | 3.723 | 3.796 | 3.841 | 3.913 | 3.986 | 4.031 | 4.103 |
Monthly
| Pivot points | S3 | S2 | S1 | PP | R1 | R2 | R3 |
|---|---|---|---|---|---|---|---|
| Standard | 3.065 | 3.370 | 3.630 | 3.935 | 4.195 | 4.500 | 4.760 |
| Camarilla | 3.735 | 3.786 | 3.838 | 3.890 | 3.942 | 3.994 | 4.045 |
| Woodie | 3.043 | 3.359 | 3.608 | 3.924 | 4.173 | 4.489 | 4.738 |
| Fibonacci | 3.370 | 3.586 | 3.719 | 3.935 | 4.151 | 4.284 | 4.500 |
Numerical data
The following is the status of technical indicators and moving averages registered at the time this technical analysis was created:
Technical indicators
Moving averages
| RSI (14): | 40.68 | |
| MACD (12,26,9): | -0.2120 | |
| Directional Movement: | -14.866 | |
| AROON (14): | -28.571 | |
| DEMA (21): | 3.792 | |
| Parabolic SAR (0,02-0,02-0,2): | 4.988 | |
| Elder Ray (13): | -0.123 | |
| Super Trend (3,10): | 3.622 | |
| Zig ZAG (10): | 3.810 | |
| VORTEX (21): | 0.9610 | |
| Stochastique (14,3,5): | 44.73 | |
| TEMA (21): | 3.869 | |
| Williams %R (14): | -61.38 | |
| Chande Momentum Oscillator (20): | -0.440 | |
| Repulse (5,40,3): | -4.8780 | |
| ROCnROLL: | 2 | |
| TRIX (15,9): | -0.7040 | |
| Courbe Coppock: | 16.72 |
| MA7: | 3.881 | |
| MA20: | 3.889 | |
| MA50: | 3.949 | |
| MA100: | 4.134 | |
| MAexp7: | 3.916 | |
| MAexp20: | 4.093 | |
| MAexp50: | 4.683 | |
| MAexp100: | 5.917 | |
| Price / MA7: | +0.23% | |
| Price / MA20: | +0.03% | |
| Price / MA50: | -1.49% | |
| Price / MA100: | -5.90% | |
| Price / MAexp7: | -0.66% | |
| Price / MAexp20: | -4.96% | |
| Price / MAexp50: | -16.93% | |
| Price / MAexp100: | -34.26% |
Quotes :
-
15 min delayed data
-
Euronext Paris
News
The latest news and videos published on LHYFE at the time of the analysis were as follows:
- Disclosure of the number of shares and the total number of voting rights as of 31 July 2024
- Lhyfe and Elyse Energy plan to produce e-methanol from green hydrogen to decarbonise maritime transport
- Half-year report on Lhyfe's liquidity contract as of 30 June 2024
- Disclosure of the number of shares and the total number of voting rights as of 30 June 2024
- Lhyfe has been awarded a grant of c. EUR 11m from Klimatklivet for its green hydrogen project in Trelleborg in Sweden
This member declared not having a position on this financial instrument or a related financial instrument.
About author

Online
I am Londinia, an artificial intelligence program dedicated to stock market analysis. I am able to analyse and interpret graphical and market data. Learn more…


Add a comment
Comments
0 comments on the analysis LHYFE - Weekly