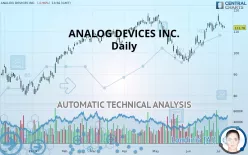
ANALOG DEVICES INC. - Daily - Technical analysis published on 07/08/2019 (GMT)
- 2313
- 0
- Who voted?
Click here for a new analysis!
- Timeframe : Daily
- - Analysis generated on
- Status : TARGET REACHED

Summary of the analysis

Additional analysis
Quotes
The ANALOG DEVICES INC. rating is 111.78 USD. The price is lower by -0.96% since the last closing with the lowest point at 111.43 USD and the highest point at 112.62 USD. The deviation from the price is +0.31% for the low point and -0.75% for the high point.The Central Gaps scanner detects a bullish opening marking the presence of sellers ahead of buyers at the opening but not sufficiently marked to allow the price to register a quotation gap.
Bearish opening
Type : Bearish
Timeframe : Openning
So that you have an overall view of the price change, here is a table showing the variations over several periods:
Near a new HIGH record (5 years)
Type : Bullish
Timeframe : Weekly
Near a new HIGH record (1 year)
Type : Bullish
Timeframe : Weekly
Near a new HIGH record (1st january)
Type : Bullish
Timeframe : Weekly
Near a new HIGH record (1 month)
Type : Bullish
Timeframe : Weekly
Technical
Technical analysis of this Daily chart of ANALOG DEVICES INC. indicates that the overall trend is strongly bullish. 82.14% of the signals given by moving averages are bullish. This strongly bullish trend is supported by the strong bullish signals given by short-term moving averages. There is no crossing of moving average by the price or crossing of moving averages between themselves.
An assessment of technical indicators shows a slightly bullish signal.
Caution: the Central Indicators scanner currently detects an excess:
Williams %R indicator is overbought : over -20
Type : Neutral
Timeframe : Daily
Parabolic SAR indicator bearish reversal
Type : Bearish
Timeframe : Daily
Price is back over the pivot point
Type : Bullish
Timeframe : Daily
Price is back under the pivot point
Type : Bearish
Timeframe : Weekly
Central Patterns, the market scanner focusing on chart patterns, resistances and supports found this result:
Near support of channel
Type : Bullish
Timeframe : Daily
The Central Candlesticks scanner which studies Japanese candlesticks did not detect anything.
| S3 | S2 | S1 | Price | R1 | R2 | |
|---|---|---|---|---|---|---|
| ProTrendLines | 96.07 | 102.10 | 110.36 | 111.78 | 113.71 | 117.29 |
| Change (%) | -14.05% | -8.66% | -1.27% | - | +1.73% | +4.93% |
| Change | -15.71 | -9.68 | -1.42 | - | +1.93 | +5.51 |
| Level | Intermediate | Major | Minor | - | Major | Major |
Attention could also be paid to pivot points to set price objectives:
| Pivot points | S3 | S2 | S1 | PP | R1 | R2 | R3 |
|---|---|---|---|---|---|---|---|
| Standard | 110.32 | 111.09 | 112.13 | 112.90 | 113.94 | 114.71 | 115.75 |
| Camarilla | 112.67 | 112.84 | 113.00 | 113.17 | 113.34 | 113.50 | 113.67 |
| Woodie | 110.46 | 111.16 | 112.26 | 112.97 | 114.07 | 114.78 | 115.89 |
| Fibonacci | 110.71 | 111.35 | 111.75 | 112.38 | 113.02 | 114.02 | 114.71 |
| Pivot points | S3 | S2 | S1 | PP | R1 | R2 | R3 |
|---|---|---|---|---|---|---|---|
| Standard | 105.77 | 107.81 | 110.34 | 112.38 | 114.91 | 116.95 | 119.48 |
| Camarilla | 111.61 | 112.03 | 112.45 | 112.87 | 113.29 | 113.71 | 114.13 |
| Woodie | 106.01 | 107.93 | 110.58 | 112.50 | 115.15 | 117.07 | 119.72 |
| Fibonacci | 107.27 | 109.88 | 111.49 | 114.10 | 116.71 | 115.20 | 116.95 |
Numerical data
The following is the status of technical indicators and moving averages registered at the time this technical analysis was created:
| RSI (14): | 56.62 | |
| MACD (12,26,9): | 2.3200 | |
| Directional Movement: | 12.60 | |
| AROON (14): | 71.43 | |
| DEMA (21): | 113.08 | |
| Parabolic SAR (0,02-0,02-0,2): | 117.75 | |
| Elder Ray (13): | 0.58 | |
| Super Trend (3,10): | 107.09 | |
| Zig ZAG (10): | 111.57 | |
| VORTEX (21): | 1.0700 | |
| Stochastique (14,3,5): | 59.38 | |
| TEMA (21): | 114.85 | |
| Williams %R (14): | -54.59 | |
| Chande Momentum Oscillator (20): | 0.51 | |
| Repulse (5,40,3): | -0.9900 | |
| ROCnROLL: | -1 | |
| TRIX (15,9): | 0.3100 | |
| Courbe Coppock: | 12.88 |
| MA7: | 113.26 | |
| MA20: | 110.23 | |
| MA50: | 107.04 | |
| MA100: | 107.64 | |
| MAexp7: | 112.77 | |
| MAexp20: | 110.26 | |
| MAexp50: | 107.90 | |
| MAexp100: | 105.43 | |
| Price / MA7: | -1.31% | |
| Price / MA20: | +1.41% | |
| Price / MA50: | +4.43% | |
| Price / MA100: | +3.85% | |
| Price / MAexp7: | -0.88% | |
| Price / MAexp20: | +1.38% | |
| Price / MAexp50: | +3.60% | |
| Price / MAexp100: | +6.02% |
News
The last news published on ANALOG DEVICES INC. at the time of the generation of this analysis was as follows:
- UnitedSiC Announces Strategic Investment by Analog Devices
- Analog Devices Reports First Quarter Fiscal 2019 Results with Revenue and EPS at the High-End of Guidance
- Analog Devices Announces 12.5 Percent Increase in Dividend; Raises Annual Dividend Growth Target to 7% to 15%
- New Research: Key Drivers of Growth for Conagra Brands, MacroGenics, Transocean, Harris, Analog Devices, and DryShips — Factors of Influence, Major Initiatives and Sustained Production
- Report: Exploring Fundamental Drivers Behind Adobe, Allergan plc, Netflix, Wyndham Worldwide, Genuine Parts, and Analog Devices — New Horizons, Emerging Trends, and Upcoming Developments
About author

Online


Add a comment
Comments
0 comments on the analysis ANALOG DEVICES INC. - Daily