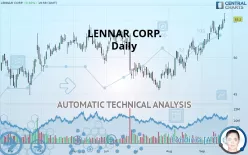
LENNAR CORP. - Daily - Technical analysis published on 09/25/2019 (GMT)
- 322
- 0
- Who voted?
Click here for a new analysis!
- Timeframe : Daily
- - Analysis generated on
- Status : TARGET REACHED

Summary of the analysis

Additional analysis
Quotes
The LENNAR CORP. rating is 55.20 USD. On the day, this instrument gained +0.57% and was between 54.70 USD and 56.05 USD. This implies that the price is at +0.91% from its lowest and at -1.52% from its highest.The Central Gaps scanner detects a bullish opening marking the presence of buyers ahead of sellers at the opening but not sufficiently marked to allow the price to register a quotation gap.
Bullish opening
Type : Bullish
Timeframe : Openning
So that you have an overall view of the price change, here is a table showing the variations over several periods:
New HIGH record (1 year)
Type : Bullish
Timeframe : Weekly
New HIGH record (1st january)
Type : Bullish
Timeframe : Weekly
New HIGH record (1 month)
Type : Bullish
Timeframe : Weekly
Technical
Technical analysis of this Daily chart of LENNAR CORP. indicates that the overall trend is strongly bullish. The signals given by the moving averages are 89.29% bullish. This strong bullish trend is confirmed by the strong signals currently being given by short-term moving averages. The Central Indicators scanner does not detect any result on moving averages that would impact this trend.
The probability of a further increase is high given the direction of the technical indicators.
But beware of excesses. The Central Indicators scanner currently detects this:
CCI indicator is overbought : over 100
Type : Neutral
Timeframe : Daily
Williams %R indicator is overbought : over -20
Type : Neutral
Timeframe : Daily
Pivot points : price is over resistance 1
Type : Neutral
Timeframe : Weekly
Parabolic SAR indicator bullish reversal
Type : Bullish
Timeframe : Daily
Price is back over the pivot point
Type : Bullish
Timeframe : Daily
Central Patterns, the market scanner focusing on chart patterns, resistances and supports found these results:
Near horizontal resistance
Type : Bearish
Timeframe : Daily
Resistance of channel is broken
Type : Bullish
Timeframe : Daily
The Central Candlesticks scanner which studies Japanese candlesticks did not detect anything.
| S3 | S2 | S1 | Price | R1 | R2 | R3 | |
|---|---|---|---|---|---|---|---|
| ProTrendLines | 49.22 | 52.02 | 53.62 | 55.20 | 55.80 | 62.30 | 71.82 |
| Change (%) | -10.83% | -5.76% | -2.86% | - | +1.09% | +12.86% | +30.11% |
| Change | -5.98 | -3.18 | -1.58 | - | +0.60 | +7.10 | +16.62 |
| Level | Major | Intermediate | Intermediate | - | Major | Intermediate | Major |
Pivot points can also be used to set your price objectives. Here is the price situation in relation to pivot points:
| Pivot points | S3 | S2 | S1 | PP | R1 | R2 | R3 |
|---|---|---|---|---|---|---|---|
| Standard | 52.70 | 53.26 | 54.08 | 54.64 | 55.46 | 56.02 | 56.84 |
| Camarilla | 54.51 | 54.64 | 54.76 | 54.89 | 55.02 | 55.14 | 55.27 |
| Woodie | 52.82 | 53.33 | 54.20 | 54.71 | 55.58 | 56.09 | 56.96 |
| Fibonacci | 53.26 | 53.79 | 54.12 | 54.64 | 55.17 | 55.50 | 56.02 |
| Pivot points | S3 | S2 | S1 | PP | R1 | R2 | R3 |
|---|---|---|---|---|---|---|---|
| Standard | 50.73 | 51.58 | 52.84 | 53.69 | 54.95 | 55.80 | 57.06 |
| Camarilla | 53.52 | 53.71 | 53.91 | 54.10 | 54.29 | 54.49 | 54.68 |
| Woodie | 50.94 | 51.68 | 53.05 | 53.79 | 55.16 | 55.90 | 57.27 |
| Fibonacci | 51.58 | 52.39 | 52.88 | 53.69 | 54.50 | 54.99 | 55.80 |
| Pivot points | S3 | S2 | S1 | PP | R1 | R2 | R3 |
|---|---|---|---|---|---|---|---|
| Standard | 42.06 | 44.53 | 47.77 | 50.24 | 53.48 | 55.95 | 59.19 |
| Camarilla | 49.43 | 49.95 | 50.48 | 51.00 | 51.52 | 52.05 | 52.57 |
| Woodie | 42.44 | 44.72 | 48.15 | 50.43 | 53.86 | 56.14 | 59.57 |
| Fibonacci | 44.53 | 46.72 | 48.06 | 50.24 | 52.43 | 53.77 | 55.95 |
Numerical data
The following are the details of the technical indicators and moving averages that were collected to generate this technical analysis:
| RSI (14): | 68.41 | |
| MACD (12,26,9): | 1.1800 | |
| Directional Movement: | 17.36 | |
| AROON (14): | 100.00 | |
| DEMA (21): | 54.57 | |
| Parabolic SAR (0,02-0,02-0,2): | 52.49 | |
| Elder Ray (13): | 1.70 | |
| Super Trend (3,10): | 51.92 | |
| Zig ZAG (10): | 55.20 | |
| VORTEX (21): | 1.1500 | |
| Stochastique (14,3,5): | 84.88 | |
| TEMA (21): | 55.03 | |
| Williams %R (14): | -17.54 | |
| Chande Momentum Oscillator (20): | 3.20 | |
| Repulse (5,40,3): | 1.2900 | |
| ROCnROLL: | 1 | |
| TRIX (15,9): | 0.3200 | |
| Courbe Coppock: | 11.01 |
| MA7: | 54.08 | |
| MA20: | 52.82 | |
| MA50: | 50.37 | |
| MA100: | 50.62 | |
| MAexp7: | 54.28 | |
| MAexp20: | 53.05 | |
| MAexp50: | 51.49 | |
| MAexp100: | 50.54 | |
| Price / MA7: | +2.07% | |
| Price / MA20: | +4.51% | |
| Price / MA50: | +9.59% | |
| Price / MA100: | +9.05% | |
| Price / MAexp7: | +1.69% | |
| Price / MAexp20: | +4.05% | |
| Price / MAexp50: | +7.21% | |
| Price / MAexp100: | +9.22% |
News
The last news published on LENNAR CORP. at the time of the generation of this analysis was as follows:
- Lennar Corporation's Third Quarter Earnings Conference Call To Be Broadcast Live On The Internet
- Lennar Corporation Declares Quarterly Dividends
- Lennar Reports Second Quarter EPS of $1.30
- The Hoffman Company Brokers Deal Transferring Aging Retail Site to Lennar Homes For 80-Unit Development in Arcadia, Calif.
- Tracy Hills Now Selling & Lennar Model Opening This Saturday, June 15th
About author

Online


Add a comment
Comments
0 comments on the analysis LENNAR CORP. - Daily