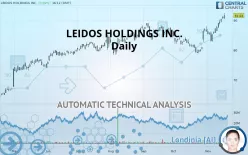
LEIDOS HOLDINGS INC. - Daily - Technical analysis published on 11/18/2019 (GMT)
- 305
- 0
- Who voted?
Click here for a new analysis!
- Timeframe : Daily
- - Analysis generated on
- Status : LEVEL MAINTAINED

Summary of the analysis

Additional analysis
Quotes
The LEIDOS HOLDINGS INC. price is 91.63 USD. On the day, this instrument gained +0.66% with the lowest point at 90.56 USD and the highest point at 92.42 USD. The deviation from the price is +1.18% for the low point and -0.85% for the high point.A bearish opening was detected by the Central Gaps scanner. Sellers are trying to impose a bearish trend in the very short term.
Bearish opening
Type : Bearish
Timeframe : Openning
So that you have an overall view of the price change, here is a table showing the variations over several periods:
New HIGH record (5 years)
Type : Bullish
Timeframe : Weekly
New HIGH record (1 year)
Type : Bullish
Timeframe : Weekly
New HIGH record (1st january)
Type : Bullish
Timeframe : Weekly
New HIGH record (1 month)
Type : Bullish
Timeframe : Weekly
Technical
Technical analysis of LEIDOS HOLDINGS INC. in Daily shows a strongly overall bullish trend. 92.86% of the signals given by moving averages are bullish. The overall trend is supported by the strong bullish signals from short-term moving averages. The Central Indicators market scanner is currently detecting a bullish signal that could impact this trend:
Moving Average bullish crossovers : MA20 & MA50
Type : Bullish
Timeframe : Daily
The probability of a further increase is high given the direction of the technical indicators.
Caution: the Central Indicators scanner currently detects an excess:
RSI indicator is overbought : over 70
Type : Neutral
Timeframe : Daily
CCI indicator is overbought : over 100
Type : Neutral
Timeframe : Daily
Williams %R indicator is overbought : over -20
Type : Neutral
Timeframe : Daily
Price is back over the pivot point
Type : Bullish
Timeframe : Daily
Price is back over the pivot point
Type : Bullish
Timeframe : Weekly
No signals are given by Central Patterns, a market scanner specialised in chart patterns, resistances and supports.
The Central Candlesticks scanner which studies Japanese candlesticks did not detect anything.
| S3 | S2 | S1 | Price | |
|---|---|---|---|---|
| ProTrendLines | 78.98 | 84.36 | 88.82 | 91.63 |
| Change (%) | -13.81% | -7.93% | -3.07% | - |
| Change | -12.65 | -7.27 | -2.81 | - |
| Level | Major | Minor | Major | - |
To determine price objectives, it is also possible to use the pivot points. Here is the price position in relation to pivot points:
| Pivot points | S3 | S2 | S1 | PP | R1 | R2 | R3 |
|---|---|---|---|---|---|---|---|
| Standard | 89.43 | 89.93 | 90.48 | 90.97 | 91.52 | 92.01 | 92.57 |
| Camarilla | 90.74 | 90.84 | 90.93 | 91.03 | 91.13 | 91.22 | 91.32 |
| Woodie | 89.46 | 89.94 | 90.51 | 90.98 | 91.55 | 92.03 | 92.60 |
| Fibonacci | 89.93 | 90.32 | 90.57 | 90.97 | 91.37 | 91.61 | 92.01 |
| Pivot points | S3 | S2 | S1 | PP | R1 | R2 | R3 |
|---|---|---|---|---|---|---|---|
| Standard | 82.74 | 84.57 | 87.80 | 89.63 | 92.86 | 94.69 | 97.92 |
| Camarilla | 89.64 | 90.10 | 90.57 | 91.03 | 91.49 | 91.96 | 92.42 |
| Woodie | 83.44 | 84.92 | 88.50 | 89.98 | 93.56 | 95.04 | 98.62 |
| Fibonacci | 84.57 | 86.50 | 87.70 | 89.63 | 91.56 | 92.76 | 94.69 |
| Pivot points | S3 | S2 | S1 | PP | R1 | R2 | R3 |
|---|---|---|---|---|---|---|---|
| Standard | 71.55 | 75.18 | 80.70 | 84.33 | 89.86 | 93.48 | 99.01 |
| Camarilla | 83.71 | 84.55 | 85.39 | 86.23 | 87.07 | 87.91 | 88.75 |
| Woodie | 72.50 | 75.65 | 81.65 | 84.80 | 90.81 | 93.96 | 99.96 |
| Fibonacci | 75.18 | 78.67 | 80.83 | 84.33 | 87.82 | 89.98 | 93.48 |
Numerical data
The following are the details of the technical indicators and moving averages that were collected to generate this technical analysis:
| RSI (14): | 71.37 | |
| MACD (12,26,9): | 1.9500 | |
| Directional Movement: | 23.96 | |
| AROON (14): | 57.14 | |
| DEMA (21): | 88.94 | |
| Parabolic SAR (0,02-0,02-0,2): | 86.12 | |
| Elder Ray (13): | 3.56 | |
| Super Trend (3,10): | 86.54 | |
| Zig ZAG (10): | 91.21 | |
| VORTEX (21): | 1.2000 | |
| Stochastique (14,3,5): | 93.98 | |
| TEMA (21): | 90.61 | |
| Williams %R (14): | -12.83 | |
| Chande Momentum Oscillator (20): | 4.94 | |
| Repulse (5,40,3): | 1.9300 | |
| ROCnROLL: | 1 | |
| TRIX (15,9): | 0.1900 | |
| Courbe Coppock: | 16.52 |
| MA7: | 89.47 | |
| MA20: | 85.52 | |
| MA50: | 84.82 | |
| MA100: | 83.76 | |
| MAexp7: | 89.54 | |
| MAexp20: | 86.83 | |
| MAexp50: | 85.01 | |
| MAexp100: | 82.62 | |
| Price / MA7: | +2.41% | |
| Price / MA20: | +7.14% | |
| Price / MA50: | +8.03% | |
| Price / MA100: | +9.40% | |
| Price / MAexp7: | +2.33% | |
| Price / MAexp20: | +5.53% | |
| Price / MAexp50: | +7.79% | |
| Price / MAexp100: | +10.91% |
News
The latest news and videos published on LEIDOS HOLDINGS INC. at the time of the analysis were as follows:
- Leidos Contributes $500,000 to the Capital Campaign for the National Museum of the United States Army
- Leidos Teams Up With Capitals for Annual Cancer Campaign
- Leidos To Participate In The Baird 2019 Global Industrials Conference
- Leidos Holdings, Inc. Reports Third Quarter Fiscal Year 2019 Results
- Leidos Holdings, Inc. Declares Quarterly Cash Dividend
About author

Online


Add a comment
Comments
0 comments on the analysis LEIDOS HOLDINGS INC. - Daily