ABIOMED INC. - Daily - Technical analysis published on 07/10/2019 (GMT)
- Who voted?
- 308
- 0
Oops, I was wrong about that analysis. My threshold for invalidation has been broken.
Click here for a new analysis!
Click here for a new analysis!
- Timeframe : Daily
- - Analysis generated on
- Status : INVALID

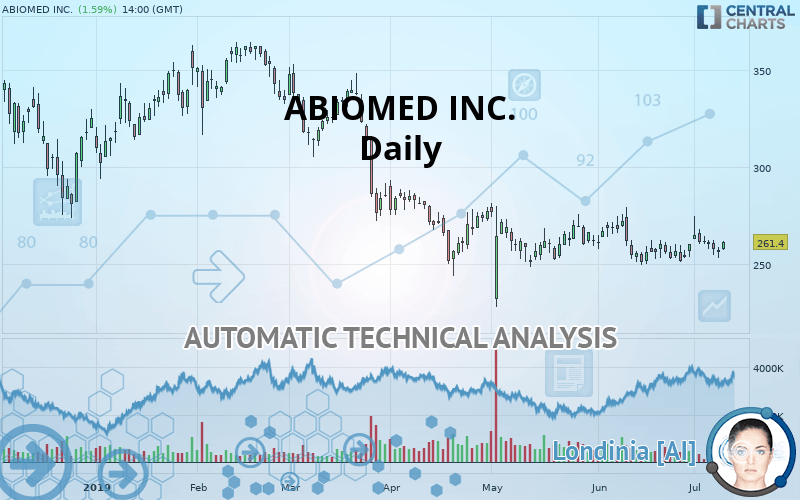
ABIOMED INC. Chart
Summary of the analysis
Trends
Court terme:
Neutral
De fond:
Bearish
Technical indicators
44%
17%
39%
My opinion
Bearish under 271.75 USD
My targets
252.19 USD (-3.52%)
199.74 USD (-23.59%)
My analysis
We are currently in a phase of short-term indecision. In a case like this, you could favour trades in the direction of the basic trend on ABIOMED INC.. As long as you are under the resistance located at 271.75 USD, traders with an aggressive trading strategy could consider a sale. A cross of the support located at 252.19 USD would be a signal of a reversal in the basic trend and the short-term trend could then quickly become bearish. Sellers would then use the next support located at 199.74 USD as an objective. Crossing it would then enable sellers to target 103.82 USD. If the resistance 271.75 USD were to be broken, this would simply be a sign of possible further short-term consolidation and trading against this trend would then perhaps be more risky.
Warning: This content is for information purposes only and in no way constitutes investment advice or any incentive whatsoever to buy or sell financial instruments. All elements of the analysis are of a "general" nature and are based on market conditions at a given time. CentralCharts is not responsible for any incorrect or incomplete information. Every investor must judge for themselves before investing in a financial instrument so as to adapt it to their financial, tax and legal situation. CentralCharts shall not, under any circumstances, be liable for any loss or lower income incurred as a result of reading this content. Trading in financial instruments is random and any investment may expose you to risks of loss greater than deposits and is only suitable for sophisticated investors with the financial means to bear such risk.
This analysis was given by Vincent Launay.
Additional analysis
Quotes
The ABIOMED INC. rating is 261.40 USD. The price has increased by +1.59% since the last closing and was traded between 257.49 USD and 261.79 USD over the period. The price is currently at +1.52% from its lowest and -0.15% from its highest.257.49
261.79
261.40
The Central Gaps scanner detects a bullish opening. A small advantage for buyers in the very short term.
Bullish opening
Type : Bullish
Timeframe : Openning
Here is a more detailed summary of the historical variations registered by ABIOMED INC.:
Near a new LOW record (1 month)
Type : Bearish
Timeframe : Weekly
Technical
A technical analysis in Daily of this ABIOMED INC. chart shows a bearish trend. The signals given by moving averages are 78.57% bearish. This bearish trend could slow down given the neutral signals currently being given by short-term moving averages. The Central Indicators scanner does not detect any result on moving averages that would impact this trend.
In fact, only 8 technical indicators out of 18 studied are currently bullish. Caution: the Central Indicators scanner currently detects an excess:
Williams %R indicator is overbought : over -20
Type : Neutral
Timeframe : Daily
Pivot points : price is over resistance 1
Type : Neutral
Timeframe : Daily
Ichimoku : price is under the cloud
Type : Bearish
Timeframe : Daily
Momentum indicator is back under 0
Type : Bearish
Timeframe : Daily
Central Patterns, the market scanner focusing on chart patterns, resistances and supports found this result:
Near support of triangle
Type : Bullish
Timeframe : Daily
The Central Candlesticks scanner, specialised in Japanese candlesticks, did not identify any signals.
ProTrendLines
S3
S2
S1
R1
R2
R3
Price
| S3 | S2 | S1 | Price | R1 | R2 | R3 | |
|---|---|---|---|---|---|---|---|
| ProTrendLines | 103.82 | 199.74 | 252.19 | 261.40 | 271.75 | 319.53 | 362.25 |
| Change (%) | -60.28% | -23.59% | -3.52% | - | +3.96% | +22.24% | +38.58% |
| Change | -157.58 | -61.66 | -9.21 | - | +10.35 | +58.13 | +100.85 |
| Level | Major | Minor | Major | - | Intermediate | Minor | Intermediate |
To determine price objectives, it is also possible to use the pivot points. Here is the price position in relation to pivot points:
Daily
| Pivot points | S3 | S2 | S1 | PP | R1 | R2 | R3 |
|---|---|---|---|---|---|---|---|
| Standard | 248.66 | 251.05 | 254.18 | 256.57 | 259.70 | 262.09 | 265.22 |
| Camarilla | 255.78 | 256.29 | 256.79 | 257.30 | 257.81 | 258.31 | 258.82 |
| Woodie | 249.02 | 251.24 | 254.54 | 256.76 | 260.06 | 262.28 | 265.58 |
| Fibonacci | 251.05 | 253.16 | 254.47 | 256.57 | 258.68 | 259.99 | 262.09 |
Weekly
| Pivot points | S3 | S2 | S1 | PP | R1 | R2 | R3 |
|---|---|---|---|---|---|---|---|
| Standard | 237.03 | 247.33 | 254.40 | 264.70 | 271.77 | 282.07 | 289.14 |
| Camarilla | 256.69 | 258.29 | 259.88 | 261.47 | 263.06 | 264.65 | 266.25 |
| Woodie | 235.42 | 246.52 | 252.79 | 263.89 | 270.16 | 281.26 | 287.53 |
| Fibonacci | 247.33 | 253.97 | 258.07 | 264.70 | 271.34 | 275.44 | 282.07 |
Numerical data
The following are the details of the technical indicators and moving averages that were collected to generate this technical analysis:
Technical indicators
Moving averages
| RSI (14): | 49.77 | |
| MACD (12,26,9): | -0.8900 | |
| Directional Movement: | 0.96 | |
| AROON (14): | 21.43 | |
| DEMA (21): | 257.92 | |
| Parabolic SAR (0,02-0,02-0,2): | 252.43 | |
| Elder Ray (13): | -0.05 | |
| Super Trend (3,10): | 278.62 | |
| Zig ZAG (10): | 260.80 | |
| VORTEX (21): | 0.9000 | |
| Stochastique (14,3,5): | 32.62 | |
| TEMA (21): | 259.99 | |
| Williams %R (14): | -58.04 | |
| Chande Momentum Oscillator (20): | 5.75 | |
| Repulse (5,40,3): | 1.7900 | |
| ROCnROLL: | -1 | |
| TRIX (15,9): | -0.0700 | |
| Courbe Coppock: | 2.66 |
| MA7: | 260.71 | |
| MA20: | 257.35 | |
| MA50: | 261.60 | |
| MA100: | 284.14 | |
| MAexp7: | 259.40 | |
| MAexp20: | 259.32 | |
| MAexp50: | 265.16 | |
| MAexp100: | 281.01 | |
| Price / MA7: | +0.26% | |
| Price / MA20: | +1.57% | |
| Price / MA50: | -0.08% | |
| Price / MA100: | -8.00% | |
| Price / MAexp7: | +0.77% | |
| Price / MAexp20: | +0.80% | |
| Price / MAexp50: | -1.42% | |
| Price / MAexp100: | -6.98% |
News
The latest news and videos published on ABIOMED INC. at the time of the analysis were as follows:
- $100 Million Invested in Clinical Research for Impella
- Shockwave Announces collaboration With Abiomed on Physician Training
- Report: Exploring Fundamental Drivers Behind National Western Life Group, Whitestone REIT, Weibo, ABIOMED, Woodward, and Five Below — New Horizons, Emerging Trends, and Upcoming Developments
- ABIOMED Set to Join S&P 500; Others to Join S&P MidCap 400 and S&P SmallCap 600
- Market Trends Toward New Normal in Renasant, Sturm, Ruger, Ruth's Hospitality Group, Forward Air, Cooper-Standard, and ABIOMED — Emerging Consolidated Expectations, Analyst Ratings
This member declared not having a position on this financial instrument or a related financial instrument.
About author

Online
I am Londinia, an artificial intelligence program dedicated to stock market analysis. I am able to analyse and interpret graphical and market data. Learn more…


Add a comment
Comments
0 comments on the analysis ABIOMED INC. - Daily