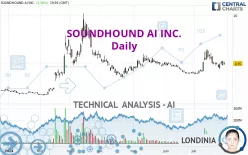
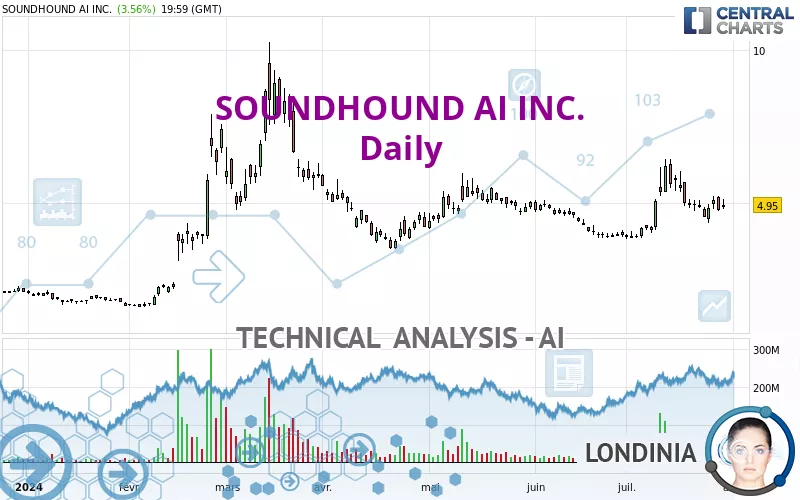
SOUNDHOUND AI INC. - Daily - Technical analysis published on 07/31/2024 (GMT)
- 136
- 0
Click here for a new analysis!
- Timeframe : Daily
- - Analysis generated on
- Status : INVALID
Summary of the analysis

Additional analysis
Quotes
The SOUNDHOUND AI INC. price is 4.95 USD. On the day, this instrument gained +3.56% with the lowest point at 4.81 USD and the highest point at 5.14 USD. The deviation from the price is +2.91% for the low point and -3.70% for the high point.The Central Gaps scanner detects a bullish opening. A small advantage for buyers in the very short term.
Bullish opening
Type : Bullish
Timeframe : Openning
So that you have an overall view of the price change, here is a table showing the variations over several periods:
Technical
Technical analysis of SOUNDHOUND AI INC. in Daily shows an overall bullish trend. 64.29% of the signals given by moving averages are bullish. The overall trend is reinforced by the strong bullish signals from short-term moving averages. The Central Indicators market scanner is currently detecting a bullish signal that could impact this trend:
Bullish price crossover with Moving Average 20
Type : Bullish
Timeframe : Daily
In fact, Central Analyzer took into account 18 technical indicators and the result was as follows: 5 are bullish, 10 are neutral and 3 are bearish. Central Indicators, the detector scanner for these technical indicators has recently detected several signals:
RSI indicator is back over 50
Type : Bullish
Timeframe : Daily
Ichimoku - Bearish crossover : Tenkan & Kijun
Type : Bearish
Timeframe : Daily
Price is back over the pivot point
Type : Bullish
Timeframe : Daily
The analysis of the price chart with Central Patterns scanners does not return any result.
For a small rebound in the very short term, the Central Candlesticks scanner currently notes the presence of this bullish pattern in Japanese candlesticks:
Bullish harami
Type : Bullish
Timeframe : Daily
| S3 | S2 | S1 | Price | R1 | R2 | R3 | |
|---|---|---|---|---|---|---|---|
| ProTrendLines | 2.60 | 3.55 | 4.68 | 4.95 | 5.52 | 6.20 | 7.42 |
| Change (%) | -47.47% | -28.28% | -5.45% | - | +11.52% | +25.25% | +49.90% |
| Change | -2.35 | -1.40 | -0.27 | - | +0.57 | +1.25 | +2.47 |
| Level | Intermediate | Intermediate | Major | - | Major | Major | Minor |
Pivot points can also be used to set your price objectives. Here is the price situation in relation to pivot points:
| Pivot points | S3 | S2 | S1 | PP | R1 | R2 | R3 |
|---|---|---|---|---|---|---|---|
| Standard | 4.46 | 4.64 | 4.79 | 4.97 | 5.12 | 5.30 | 5.45 |
| Camarilla | 4.86 | 4.89 | 4.92 | 4.95 | 4.98 | 5.01 | 5.04 |
| Woodie | 4.46 | 4.63 | 4.79 | 4.96 | 5.12 | 5.29 | 5.45 |
| Fibonacci | 4.64 | 4.76 | 4.84 | 4.97 | 5.09 | 5.17 | 5.30 |
| Pivot points | S3 | S2 | S1 | PP | R1 | R2 | R3 |
|---|---|---|---|---|---|---|---|
| Standard | 3.74 | 4.05 | 4.59 | 4.90 | 5.44 | 5.75 | 6.29 |
| Camarilla | 4.89 | 4.96 | 5.04 | 5.12 | 5.20 | 5.28 | 5.35 |
| Woodie | 3.85 | 4.11 | 4.70 | 4.96 | 5.55 | 5.81 | 6.40 |
| Fibonacci | 4.05 | 4.38 | 4.58 | 4.90 | 5.23 | 5.43 | 5.75 |
| Pivot points | S3 | S2 | S1 | PP | R1 | R2 | R3 |
|---|---|---|---|---|---|---|---|
| Standard | 2.24 | 3.05 | 3.50 | 4.31 | 4.76 | 5.57 | 6.02 |
| Camarilla | 3.60 | 3.72 | 3.84 | 3.95 | 4.07 | 4.18 | 4.30 |
| Woodie | 2.06 | 2.96 | 3.32 | 4.22 | 4.58 | 5.48 | 5.84 |
| Fibonacci | 3.05 | 3.53 | 3.83 | 4.31 | 4.79 | 5.09 | 5.57 |
Numerical data
The following is the status of technical indicators and moving averages registered at the time this technical analysis was created:
| RSI (14): | 51.91 | |
| MACD (12,26,9): | 0.1000 | |
| Directional Movement: | 4.15 | |
| AROON (14): | 14.29 | |
| DEMA (21): | 5.01 | |
| Parabolic SAR (0,02-0,02-0,2): | 5.59 | |
| Elder Ray (13): | 0.05 | |
| Super Trend (3,10): | 6.13 | |
| Zig ZAG (10): | 4.95 | |
| VORTEX (21): | 1.0600 | |
| Stochastique (14,3,5): | 33.62 | |
| TEMA (21): | 5.07 | |
| Williams %R (14): | -72.12 | |
| Chande Momentum Oscillator (20): | -1.25 | |
| Repulse (5,40,3): | -5.7500 | |
| ROCnROLL: | 1 | |
| TRIX (15,9): | 0.4500 | |
| Courbe Coppock: | 16.20 |
| MA7: | 4.88 | |
| MA20: | 4.90 | |
| MA50: | 4.72 | |
| MA100: | 5.05 | |
| MAexp7: | 4.93 | |
| MAexp20: | 4.87 | |
| MAexp50: | 4.76 | |
| MAexp100: | 4.57 | |
| Price / MA7: | +1.43% | |
| Price / MA20: | +1.02% | |
| Price / MA50: | +4.87% | |
| Price / MA100: | -1.98% | |
| Price / MAexp7: | +0.41% | |
| Price / MAexp20: | +1.64% | |
| Price / MAexp50: | +3.99% | |
| Price / MAexp100: | +8.32% |
About author

Online


Add a comment
Comments
0 comments on the analysis SOUNDHOUND AI INC. - Daily