LAS VEGAS SANDS - Daily - Technical analysis published on 01/31/2025 (GMT)
- 104
- 0
- Timeframe : Daily
- - Analysis generated on
- Status : NEUTRAL

Summary of the analysis

Additional analysis
Quotes
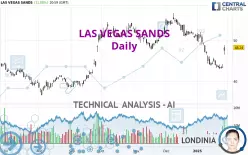
The LAS VEGAS SANDS price is 48.24 USD. The price has increased by +11.08% since the last closing with the lowest point at 46.53 USD and the highest point at 48.73 USD. The deviation from the price is +3.68% for the low point and -1.01% for the high point.The Central Gaps scanner detects a bullish gap which is a sign that buyers have taken the lead in the very short term.
Opening Gap UP
Type : Bullish
Timeframe : Openning
So that you have an overall view of the price change, here is a table showing the variations over several periods:
Technical
Technical analysis of this Daily chart of LAS VEGAS SANDS indicates that the overall trend is slightly bearish. 60.71% of the signals given by moving averages are bullish. As the signals currently given by short-term moving averages are rather neutral, the overall trend could quickly return to neutral as well. The Central Indicators scanner detects bullish signals on moving averages that could impact this trend:
Bullish price crossover with Moving Average 20
Type : Bullish
Timeframe : Daily
Bullish price crossover with adaptative moving average 20
Type : Bullish
Timeframe : Daily
In fact, only 9 technical indicators out of 18 studied are currently positioned bullish. But beware of excesses. The Central Indicators scanner currently detects this:
Williams %R indicator is overbought : over -20
Type : Neutral
Timeframe : Daily
Pivot points : price is over resistance 3
Type : Neutral
Timeframe : Daily
Pivot points : price is over resistance 3
Type : Neutral
Timeframe : Weekly
RSI indicator is back over 50
Type : Bullish
Timeframe : Daily
MACD crosses UP its Moving Average
Type : Bullish
Timeframe : Daily
Parabolic SAR indicator bullish reversal
Type : Bullish
Timeframe : Daily
SuperTrend indicator bullish reversal
Type : Bullish
Timeframe : Daily
Momentum indicator is back over 0
Type : Bullish
Timeframe : Daily
No signals are given by Central Patterns, a market scanner specialised in chart patterns, resistances and supports.
The presence of a bullish Japanese candlestick pattern detected by Central Candlesticks that could cause a very short term rebound was also detected:
Upside gap
Type : Bullish
Timeframe : Daily
| S3 | S2 | S1 | Price | R1 | R2 | R3 | |
|---|---|---|---|---|---|---|---|
| ProTrendLines | 41.11 | 43.75 | 47.96 | 48.24 | 50.55 | 54.51 | 63.31 |
| Change (%) | -14.78% | -9.31% | -0.58% | - | +4.79% | +13.00% | +31.24% |
| Change | -7.13 | -4.49 | -0.28 | - | +2.31 | +6.27 | +15.07 |
| Level | Intermediate | Major | Intermediate | - | Intermediate | Major | Major |
Attention could also be paid to pivot points to set price objectives:
| Pivot points | S3 | S2 | S1 | PP | R1 | R2 | R3 |
|---|---|---|---|---|---|---|---|
| Standard | 44.74 | 45.63 | 46.94 | 47.83 | 49.14 | 50.03 | 51.34 |
| Camarilla | 47.64 | 47.84 | 48.04 | 48.24 | 48.44 | 48.64 | 48.85 |
| Woodie | 44.94 | 45.74 | 47.14 | 47.94 | 49.34 | 50.14 | 51.54 |
| Fibonacci | 45.63 | 46.47 | 46.99 | 47.83 | 48.67 | 49.19 | 50.03 |
| Pivot points | S3 | S2 | S1 | PP | R1 | R2 | R3 |
|---|---|---|---|---|---|---|---|
| Standard | 39.98 | 41.58 | 42.54 | 44.14 | 45.10 | 46.70 | 47.66 |
| Camarilla | 42.80 | 43.03 | 43.27 | 43.50 | 43.74 | 43.97 | 44.20 |
| Woodie | 39.66 | 41.42 | 42.22 | 43.98 | 44.78 | 46.54 | 47.34 |
| Fibonacci | 41.58 | 42.56 | 43.16 | 44.14 | 45.12 | 45.72 | 46.70 |
| Pivot points | S3 | S2 | S1 | PP | R1 | R2 | R3 |
|---|---|---|---|---|---|---|---|
| Standard | 42.92 | 46.71 | 49.03 | 52.82 | 55.14 | 58.93 | 61.25 |
| Camarilla | 49.68 | 50.24 | 50.80 | 51.36 | 51.92 | 52.48 | 53.04 |
| Woodie | 42.20 | 46.34 | 48.31 | 52.45 | 54.42 | 58.56 | 60.53 |
| Fibonacci | 46.71 | 49.04 | 50.48 | 52.82 | 55.15 | 56.59 | 58.93 |
Numerical data
The following is the status of technical indicators and moving averages registered at the time this technical analysis was created:
| RSI (14): | 54.87 | |
| MACD (12,26,9): | -1.6900 | |
| Directional Movement: | 7.57 | |
| AROON (14): | -85.71 | |
| DEMA (21): | 43.97 | |
| Parabolic SAR (0,02-0,02-0,2): | 43.01 | |
| Elder Ray (13): | 2.27 | |
| Super Trend (3,10): | 42.85 | |
| Zig ZAG (10): | 48.24 | |
| VORTEX (21): | 0.6900 | |
| Stochastique (14,3,5): | 33.06 | |
| TEMA (21): | 43.26 | |
| Williams %R (14): | -9.98 | |
| Chande Momentum Oscillator (20): | 1.37 | |
| Repulse (5,40,3): | 1.3200 | |
| ROCnROLL: | -1 | |
| TRIX (15,9): | -0.5800 | |
| Courbe Coppock: | 18.96 |
| MA7: | 44.19 | |
| MA20: | 46.38 | |
| MA50: | 49.86 | |
| MA100: | 49.13 | |
| MAexp7: | 44.94 | |
| MAexp20: | 46.27 | |
| MAexp50: | 48.30 | |
| MAexp100: | 48.31 | |
| Price / MA7: | +9.16% | |
| Price / MA20: | +4.01% | |
| Price / MA50: | -3.25% | |
| Price / MA100: | -1.81% | |
| Price / MAexp7: | +7.34% | |
| Price / MAexp20: | +4.26% | |
| Price / MAexp50: | -0.12% | |
| Price / MAexp100: | -0.14% |
News
The latest news and videos published on LAS VEGAS SANDS at the time of the analysis were as follows:
- International Volunteer Day 2024: Sands Team Members Drive Positive Impact in Communities Around the World
- Igniting Change: 2024 Nevada Youth Homelessness Summit Advances Statewide Collaboration To Create Lasting Solutions
- 2024 Sands Cares Global Hygiene Kit Build Nets 70,000 Kits for Clean the World and 1 Million Since 2014
- Las Vegas Sands Named to the Dow Jones Sustainability Indices for World and North America
- Sands China Collaborates With the Macao Government To Revitalize Iconic Landmarks
About author

Online


Add a comment
Comments
0 comments on the analysis LAS VEGAS SANDS - Daily