LANDSTAR SYSTEM INC. - Daily - Technical analysis published on 12/12/2019 (GMT)
- 238
- 0
- Who voted?
- Timeframe : Daily
- - Analysis generated on
- Status : NEUTRAL

Summary of the analysis

Additional analysis
Quotes
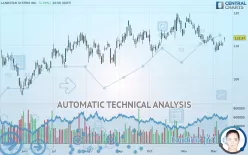
LANDSTAR SYSTEM INC. rating 112.37 USD. The price has increased by +1.59% since the last closing with the lowest point at 111.36 USD and the highest point at 112.62 USD. The deviation from the price is +0.91% for the low point and -0.22% for the high point.The Central Gaps scanner detects the formation of a bullish gap marking the strong presence of buyers against sellers at the opening. This formed a quotation gap.
Opening Gap UP
Type : Bullish
Timeframe : Openning
A study of price movements over other periods shows the following variations:
Technical
Technical analysis of LANDSTAR SYSTEM INC. in Daily shows an overall slightly bullish trend. Only 57.14% of the signals given by moving averages are bullish. This slightly bullish trend could return to neutral given the neutral signals also given by short-term moving averages. There is no crossing of moving average by the price or crossing of moving averages between themselves.
The technical indicators are bullish. There is still some doubt about the price increase.
But beware of excesses. The Central Indicators scanner currently detects this:
Williams %R indicator is overbought : over -20
Type : Neutral
Timeframe : Daily
Pivot points : price is over resistance 1
Type : Neutral
Timeframe : Weekly
Pivot points : price is over resistance 2
Type : Neutral
Timeframe : Daily
Price is back under the pivot point
Type : Bearish
Timeframe : Weekly
Central Patterns, the market scanner focusing on chart patterns, resistances and supports found these results:
Horizontal resistance is broken
Type : Bullish
Timeframe : Daily
Resistance of triangle is broken
Type : Bullish
Timeframe : Daily
The Central Candlesticks scanner, specialised in Japanese candlesticks, did not identify any signals.
| S3 | S2 | S1 | Price | R1 | R2 | R3 | |
|---|---|---|---|---|---|---|---|
| ProTrendLines | 104.64 | 108.73 | 111.30 | 112.37 | 113.97 | 116.10 | 118.48 |
| Change (%) | -6.88% | -3.24% | -0.95% | - | +1.42% | +3.32% | +5.44% |
| Change | -7.73 | -3.64 | -1.07 | - | +1.60 | +3.73 | +6.11 |
| Level | Major | Major | Intermediate | - | Major | Major | Minor |
Pivot points can also be used to set your price objectives. Here is the price situation in relation to pivot points:
| Pivot points | S3 | S2 | S1 | PP | R1 | R2 | R3 |
|---|---|---|---|---|---|---|---|
| Standard | 108.70 | 109.28 | 109.94 | 110.52 | 111.18 | 111.76 | 112.42 |
| Camarilla | 110.27 | 110.38 | 110.50 | 110.61 | 110.72 | 110.84 | 110.95 |
| Woodie | 108.75 | 109.30 | 109.99 | 110.54 | 111.23 | 111.78 | 112.47 |
| Fibonacci | 109.28 | 109.75 | 110.04 | 110.52 | 110.99 | 111.28 | 111.76 |
| Pivot points | S3 | S2 | S1 | PP | R1 | R2 | R3 |
|---|---|---|---|---|---|---|---|
| Standard | 103.38 | 105.70 | 107.87 | 110.19 | 112.36 | 114.68 | 116.85 |
| Camarilla | 108.80 | 109.21 | 109.62 | 110.03 | 110.44 | 110.85 | 111.27 |
| Woodie | 103.30 | 105.66 | 107.79 | 110.15 | 112.28 | 114.64 | 116.77 |
| Fibonacci | 105.70 | 107.42 | 108.48 | 110.19 | 111.91 | 112.97 | 114.68 |
| Pivot points | S3 | S2 | S1 | PP | R1 | R2 | R3 |
|---|---|---|---|---|---|---|---|
| Standard | 98.44 | 104.40 | 107.90 | 113.86 | 117.36 | 123.32 | 126.82 |
| Camarilla | 108.81 | 109.68 | 110.54 | 111.41 | 112.28 | 113.14 | 114.01 |
| Woodie | 97.22 | 103.79 | 106.68 | 113.25 | 116.14 | 122.71 | 125.60 |
| Fibonacci | 104.40 | 108.01 | 110.24 | 113.86 | 117.47 | 119.70 | 123.32 |
Numerical data
The following are the details of the technical indicators and moving averages that were collected to generate this technical analysis:
| RSI (14): | 51.18 | |
| MACD (12,26,9): | -0.8700 | |
| Directional Movement: | 0.65 | |
| AROON (14): | -21.43 | |
| DEMA (21): | 110.61 | |
| Parabolic SAR (0,02-0,02-0,2): | 108.17 | |
| Elder Ray (13): | 0.75 | |
| Super Trend (3,10): | 115.11 | |
| Zig ZAG (10): | 112.37 | |
| VORTEX (21): | 0.8700 | |
| Stochastique (14,3,5): | 56.05 | |
| TEMA (21): | 109.95 | |
| Williams %R (14): | -22.78 | |
| Chande Momentum Oscillator (20): | 1.27 | |
| Repulse (5,40,3): | 0.5500 | |
| ROCnROLL: | 1 | |
| TRIX (15,9): | -0.1300 | |
| Courbe Coppock: | 3.56 |
| MA7: | 110.39 | |
| MA20: | 111.59 | |
| MA50: | 113.05 | |
| MA100: | 111.91 | |
| MAexp7: | 110.98 | |
| MAexp20: | 111.73 | |
| MAexp50: | 112.37 | |
| MAexp100: | 111.51 | |
| Price / MA7: | +1.79% | |
| Price / MA20: | +0.70% | |
| Price / MA50: | -0.60% | |
| Price / MA100: | +0.41% | |
| Price / MAexp7: | +1.25% | |
| Price / MAexp20: | +0.57% | |
| Price / MAexp50: | -0% | |
| Price / MAexp100: | +0.77% |
News
The latest news and videos published on LANDSTAR SYSTEM INC. at the time of the analysis were as follows:
- Landstar System, Inc. to Host Earnings Call
- Landstar System, Inc. to Host Earnings Call
- Investor Network: Landstar System, Inc. to Host Earnings Call
-
 Landstar System
- Landstar System Reports Record Quarterly Revenue of $893 Million and Record Quarterly Diluted Earnings Per Share From Continuing Operations of $0.94
About author

Online


Add a comment
Comments
0 comments on the analysis LANDSTAR SYSTEM INC. - Daily