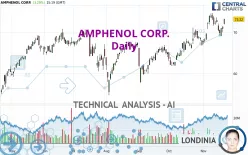
AMPHENOL CORP. - Daily - Technical analysis published on 11/21/2024 (GMT)
- 93
- 0
Click here for a new analysis!
- Timeframe : Daily
- - Analysis generated on
- Status : INVALID

Summary of the analysis

Additional analysis
Quotes
The AMPHENOL CORP. rating is 73.22 USD. The price has increased by +3.29% since the last closing and was between 72.00 USD and 73.35 USD. This implies that the price is at +1.69% from its lowest and at -0.18% from its highest.The Central Gaps scanner detects a bullish gap which is a sign that buyers have taken the lead in the very short term.
Opening Gap UP
Type : Bullish
Timeframe : Openning
So that you have an overall view of the price change, here is a table showing the variations over several periods:
Near a new HIGH record (5 years)
Type : Bullish
Timeframe : Weekly
Near a new HIGH record (1 year)
Type : Bullish
Timeframe : Weekly
Near a new HIGH record (1st january)
Type : Bullish
Timeframe : Weekly
Near a new HIGH record (1 month)
Type : Bullish
Timeframe : Weekly
Technical
Technical analysis of AMPHENOL CORP. in Daily shows a strongly overall bullish trend. 92.86% of the signals given by moving averages are bullish. The overall trend is supported by the strong bullish signals from short-term moving averages. There is no crossing of moving average by the price or crossing of moving averages between themselves.
In fact, Central Analyzer took into account 18 technical indicators and the result was as follows: 6 are bullish, 7 are neutral and 5 are bearish. Central Indicators, the scanner specialised in technical indicators, has identified these signals:
Pivot points : price is over resistance 2
Type : Neutral
Timeframe : Daily
Price is back over the pivot point
Type : Bullish
Timeframe : Weekly
Williams %R indicator is back over -50
Type : Bullish
Timeframe : Daily
An analysis of the price chart with the Central Patterns scanner (detector of chart patterns and resistances and supports) shows a result that can have an impact on the price change:
Near horizontal resistance
Type : Bearish
Timeframe : Daily
The Central Candlesticks scanner which studies Japanese candlesticks did not detect anything.
| S3 | S2 | S1 | Price | R1 | |
|---|---|---|---|---|---|
| ProTrendLines | 62.07 | 67.11 | 70.22 | 73.22 | 73.95 |
| Change (%) | -15.23% | -8.34% | -4.10% | - | +1.00% |
| Change | -11.15 | -6.11 | -3.00 | - | +0.73 |
| Level | Minor | Major | Major | - | Major |
Pivot points can also be used to set your price objectives. Here is the price situation in relation to pivot points:
| Pivot points | S3 | S2 | S1 | PP | R1 | R2 | R3 |
|---|---|---|---|---|---|---|---|
| Standard | 68.69 | 69.34 | 70.12 | 70.77 | 71.55 | 72.20 | 72.98 |
| Camarilla | 70.50 | 70.63 | 70.76 | 70.89 | 71.02 | 71.15 | 71.28 |
| Woodie | 68.75 | 69.37 | 70.18 | 70.80 | 71.61 | 72.23 | 73.04 |
| Fibonacci | 69.34 | 69.89 | 70.23 | 70.77 | 71.32 | 71.66 | 72.20 |
| Pivot points | S3 | S2 | S1 | PP | R1 | R2 | R3 |
|---|---|---|---|---|---|---|---|
| Standard | 64.48 | 67.36 | 68.94 | 71.82 | 73.40 | 76.28 | 77.86 |
| Camarilla | 69.29 | 69.70 | 70.11 | 70.52 | 70.93 | 71.34 | 71.75 |
| Woodie | 63.83 | 67.04 | 68.29 | 71.50 | 72.75 | 75.96 | 77.21 |
| Fibonacci | 67.36 | 69.06 | 70.12 | 71.82 | 73.52 | 74.58 | 76.28 |
| Pivot points | S3 | S2 | S1 | PP | R1 | R2 | R3 |
|---|---|---|---|---|---|---|---|
| Standard | 52.95 | 57.43 | 62.23 | 66.71 | 71.51 | 75.99 | 80.79 |
| Camarilla | 64.47 | 65.32 | 66.17 | 67.02 | 67.87 | 68.72 | 69.57 |
| Woodie | 53.10 | 57.51 | 62.38 | 66.79 | 71.66 | 76.07 | 80.94 |
| Fibonacci | 57.43 | 60.98 | 63.17 | 66.71 | 70.26 | 72.45 | 75.99 |
Numerical data
The following is the status of the technical indicators and moving averages at the time of publication of this technical analysis:
| RSI (14): | 55.32 | |
| MACD (12,26,9): | 1.2100 | |
| Directional Movement: | 4.69 | |
| AROON (14): | 50.00 | |
| DEMA (21): | 72.06 | |
| Parabolic SAR (0,02-0,02-0,2): | 74.08 | |
| Elder Ray (13): | -0.21 | |
| Super Trend (3,10): | 69.22 | |
| Zig ZAG (10): | 70.89 | |
| VORTEX (21): | 1.0500 | |
| Stochastique (14,3,5): | 47.05 | |
| TEMA (21): | 72.13 | |
| Williams %R (14): | -50.20 | |
| Chande Momentum Oscillator (20): | 2.67 | |
| Repulse (5,40,3): | 0.5500 | |
| ROCnROLL: | -1 | |
| TRIX (15,9): | 0.3300 | |
| Courbe Coppock: | 7.95 |
| MA7: | 71.33 | |
| MA20: | 70.52 | |
| MA50: | 67.23 | |
| MA100: | 65.92 | |
| MAexp7: | 71.36 | |
| MAexp20: | 70.32 | |
| MAexp50: | 68.17 | |
| MAexp100: | 66.12 | |
| Price / MA7: | +2.65% | |
| Price / MA20: | +3.83% | |
| Price / MA50: | +8.91% | |
| Price / MA100: | +11.07% | |
| Price / MAexp7: | +2.61% | |
| Price / MAexp20: | +4.12% | |
| Price / MAexp50: | +7.41% | |
| Price / MAexp100: | +10.74% |
News
The latest news and videos published on AMPHENOL CORP. at the time of the analysis were as follows:
- Shareholder Alert: Ademi LLP investigates whether PCTEL, Inc. has obtained a Fair Price in its transaction with Amphenol
- Amphenol Announces Third Quarter 2023 Dividend
- Amphenol Reports Second Quarter 2023 Results
- Amphenol Announces Second Quarter 2023 Dividend
- Amphenol Reports First Quarter 2023 Results
About author
Online


Add a comment
Comments
0 comments on the analysis AMPHENOL CORP. - Daily