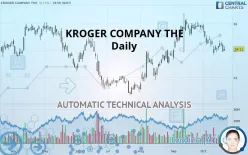
KROGER COMPANY THE - Daily - Technical analysis published on 10/22/2019 (GMT)
- 375
- 0
- Who voted?
Click here for a new analysis!
- Timeframe : Daily
- - Analysis generated on
- Status : INVALID

Summary of the analysis

Additional analysis
Quotes
KROGER COMPANY THE rating 24.11 USD. On the day, this instrument gained +0.71% and was between 23.99 USD and 24.33 USD. This implies that the price is at +0.50% from its lowest and at -0.90% from its highest.The Central Gaps scanner detects a bullish opening. A small advantage for buyers in the very short term.
Bullish opening
Type : Bullish
Timeframe : Openning
So that you have an overall view of the price change, here is a table showing the variations over several periods:
Near a new LOW record (1 month)
Type : Bearish
Timeframe : Weekly
Technical
A technical analysis in Daily of this KROGER COMPANY THE chart shows a neutral trend. The strong bearish signals currently being given by short-term moving averages could allow the overall trend to return to a bearish trend. The Central Indicators scanner detects bearish signals on moving averages that could impact this trend:
Bearish trend reversal : adaptative moving average 50
Type : Bearish
Timeframe : Daily
Bearish trend reversal : adaptative moving average 100
Type : Bearish
Timeframe : Daily
Bearish price crossover with adaptative moving average 50
Type : Bearish
Timeframe : Daily
In fact, 13 technical indicators on 18 studied are currently bearish. Caution: the Central Indicators scanner currently detects an excess:
Williams %R indicator is oversold : under -80
Type : Neutral
Timeframe : Daily
Williams %R indicator is overbought : over -20
Type : Neutral
Timeframe : Daily
Price is back under the pivot point
Type : Bearish
Timeframe : Daily
Central Patterns, the market scanner focusing on chart patterns, resistances and supports found this result:
Near support of triangle
Type : Bullish
Timeframe : Daily
No result was found by the Central Candlesticks scanner on Japanese candlesticks.
| S3 | S2 | S1 | Price | R1 | R2 | R3 | |
|---|---|---|---|---|---|---|---|
| ProTrendLines | 22.09 | 22.98 | 23.88 | 24.11 | 24.64 | 25.80 | 26.68 |
| Change (%) | -8.38% | -4.69% | -0.95% | - | +2.20% | +7.01% | +10.66% |
| Change | -2.02 | -1.13 | -0.23 | - | +0.53 | +1.69 | +2.57 |
| Level | Minor | Major | Major | - | Intermediate | Major | Intermediate |
Attention could also be paid to pivot points to set price objectives:
| Pivot points | S3 | S2 | S1 | PP | R1 | R2 | R3 |
|---|---|---|---|---|---|---|---|
| Standard | 23.08 | 23.50 | 23.72 | 24.13 | 24.35 | 24.77 | 24.99 |
| Camarilla | 23.77 | 23.82 | 23.88 | 23.94 | 24.00 | 24.06 | 24.12 |
| Woodie | 22.99 | 23.45 | 23.62 | 24.08 | 24.26 | 24.72 | 24.89 |
| Fibonacci | 23.50 | 23.74 | 23.89 | 24.13 | 24.37 | 24.52 | 24.77 |
| Pivot points | S3 | S2 | S1 | PP | R1 | R2 | R3 |
|---|---|---|---|---|---|---|---|
| Standard | 22.78 | 23.33 | 23.63 | 24.18 | 24.48 | 25.03 | 25.33 |
| Camarilla | 23.71 | 23.78 | 23.86 | 23.94 | 24.02 | 24.10 | 24.17 |
| Woodie | 22.67 | 23.27 | 23.52 | 24.12 | 24.37 | 24.97 | 25.22 |
| Fibonacci | 23.33 | 23.65 | 23.85 | 24.18 | 24.50 | 24.70 | 25.03 |
| Pivot points | S3 | S2 | S1 | PP | R1 | R2 | R3 |
|---|---|---|---|---|---|---|---|
| Standard | 20.33 | 21.81 | 23.80 | 25.28 | 27.27 | 28.75 | 30.74 |
| Camarilla | 24.83 | 25.14 | 25.46 | 25.78 | 26.10 | 26.42 | 26.73 |
| Woodie | 20.58 | 21.94 | 24.05 | 25.41 | 27.52 | 28.88 | 30.99 |
| Fibonacci | 21.81 | 23.14 | 23.96 | 25.28 | 26.61 | 27.43 | 28.75 |
Numerical data
The following is the status of the technical indicators and moving averages at the time of publication of this technical analysis:
| RSI (14): | 43.09 | |
| MACD (12,26,9): | -0.1800 | |
| Directional Movement: | -17.10 | |
| AROON (14): | -50.00 | |
| DEMA (21): | 24.43 | |
| Parabolic SAR (0,02-0,02-0,2): | 25.34 | |
| Elder Ray (13): | -0.28 | |
| Super Trend (3,10): | 25.60 | |
| Zig ZAG (10): | 24.11 | |
| VORTEX (21): | 0.7800 | |
| Stochastique (14,3,5): | 21.67 | |
| TEMA (21): | 23.98 | |
| Williams %R (14): | -77.01 | |
| Chande Momentum Oscillator (20): | -0.48 | |
| Repulse (5,40,3): | -1.8600 | |
| ROCnROLL: | 2 | |
| TRIX (15,9): | -0.0300 | |
| Courbe Coppock: | 9.99 |
| MA7: | 24.24 | |
| MA20: | 24.81 | |
| MA50: | 24.48 | |
| MA100: | 23.37 | |
| MAexp7: | 24.25 | |
| MAexp20: | 24.57 | |
| MAexp50: | 24.36 | |
| MAexp100: | 24.15 | |
| Price / MA7: | -0.54% | |
| Price / MA20: | -2.82% | |
| Price / MA50: | -1.51% | |
| Price / MA100: | +3.17% | |
| Price / MAexp7: | -0.58% | |
| Price / MAexp20: | -1.87% | |
| Price / MAexp50: | -1.03% | |
| Price / MAexp100: | -0.17% |
News
The last news published on KROGER COMPANY THE at the time of the generation of this analysis was as follows:
- Kroger to Standardize Our Brands Date Labels to Reduce Household Food Waste
- Largest Grocery Chain in U.S. Adds CELSIUS® Nationwide
-
 Kroger set to lay off hundreds of employees
-
Kroger Laying Off Hundreds Of Workers
- SS&C Health Launches Cardio Wellness Network
About author

Online


Add a comment
Comments
0 comments on the analysis KROGER COMPANY THE - Daily