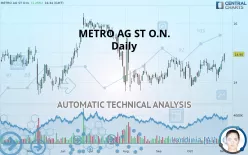
METRO AG ST O.N. - Daily - Technical analysis published on 11/04/2019 (GMT)
- 287
- 0
- Who voted?
Click here for a new analysis!
- Timeframe : Daily
- - Analysis generated on
- Status : TARGET REACHED

Summary of the analysis

Additional analysis
Quotes
The METRO AG ST O.N. rating is 14.950 EUR. On the day, this instrument gained +1.25% and was traded between 14.675 EUR and 14.985 EUR over the period. The price is currently at +1.87% from its lowest and -0.23% from its highest.So that you have an overall view of the price change, here is a table showing the variations over several periods:
Near a new HIGH record (1 month)
Type : Bullish
Timeframe : Weekly
Technical
A technical analysis in Daily of this METRO AG ST O.N. chart shows a bullish trend. 67.86% of the signals given by moving averages are bullish. This bullish trend is supported by the strong bullish signals given by short-term moving averages. An assessment of moving averages reveals several bullish signals that could impact this trend:
Bullish price crossover with adaptative moving average 50
Type : Bullish
Timeframe : Daily
Bullish price crossover with adaptative moving average 100
Type : Bullish
Timeframe : Daily
In fact, 15 technical indicators on 18 studied are currently positioned bullish. Caution: the Central Indicators scanner currently detects an excess:
CCI indicator is overbought : over 100
Type : Neutral
Timeframe : Daily
Williams %R indicator is overbought : over -20
Type : Neutral
Timeframe : Daily
Parabolic SAR indicator bullish reversal
Type : Bullish
Timeframe : Daily
Aroon indicator bullish trend
Type : Bullish
Timeframe : Daily
Price is back over the pivot point
Type : Bullish
Timeframe : Weekly
Momentum indicator is back over 0
Type : Bullish
Timeframe : Daily
An analysis of the price chart with the Central Patterns scanner (detector of chart patterns and resistances and supports) shows a result that can have an impact on the price change:
Resistance of channel is broken
Type : Bullish
Timeframe : Daily
The Central Candlesticks scanner which studies Japanese candlesticks did not detect anything.
| S3 | S2 | S1 | Price | R1 | R2 | R3 | |
|---|---|---|---|---|---|---|---|
| ProTrendLines | 14.212 | 14.593 | 14.765 | 14.950 | 15.100 | 15.500 | 16.075 |
| Change (%) | -4.94% | -2.39% | -1.24% | - | +1.00% | +3.68% | +7.53% |
| Change | -0.738 | -0.357 | -0.185 | - | +0.150 | +0.550 | +1.125 |
| Level | Minor | Intermediate | Major | - | Major | Minor | Major |
To determine price objectives, it is also possible to use the pivot points. Here is the price position in relation to pivot points:
| Pivot points | S3 | S2 | S1 | PP | R1 | R2 | R3 |
|---|---|---|---|---|---|---|---|
| Standard | 14.517 | 14.608 | 14.687 | 14.778 | 14.857 | 14.948 | 15.027 |
| Camarilla | 14.718 | 14.734 | 14.749 | 14.765 | 14.781 | 14.796 | 14.812 |
| Woodie | 14.510 | 14.605 | 14.680 | 14.775 | 14.850 | 14.945 | 15.020 |
| Fibonacci | 14.608 | 14.673 | 14.713 | 14.778 | 14.843 | 14.883 | 14.948 |
| Pivot points | S3 | S2 | S1 | PP | R1 | R2 | R3 |
|---|---|---|---|---|---|---|---|
| Standard | 13.400 | 13.715 | 14.240 | 14.555 | 15.080 | 15.395 | 15.920 |
| Camarilla | 14.534 | 14.611 | 14.688 | 14.765 | 14.842 | 14.919 | 14.996 |
| Woodie | 13.505 | 13.768 | 14.345 | 14.608 | 15.185 | 15.448 | 16.025 |
| Fibonacci | 13.715 | 14.036 | 14.234 | 14.555 | 14.876 | 15.074 | 15.395 |
| Pivot points | S3 | S2 | S1 | PP | R1 | R2 | R3 |
|---|---|---|---|---|---|---|---|
| Standard | 13.080 | 13.470 | 14.035 | 14.425 | 14.990 | 15.380 | 15.945 |
| Camarilla | 14.337 | 14.425 | 14.513 | 14.600 | 14.688 | 14.775 | 14.863 |
| Woodie | 13.168 | 13.514 | 14.123 | 14.469 | 15.078 | 15.424 | 16.033 |
| Fibonacci | 13.470 | 13.835 | 14.060 | 14.425 | 14.790 | 15.015 | 15.380 |
Numerical data
The following are the details of the technical indicators and moving averages that were collected to generate this technical analysis:
| RSI (14): | 59.85 | |
| MACD (12,26,9): | 0.0600 | |
| Directional Movement: | 2.920 | |
| AROON (14): | 28.571 | |
| DEMA (21): | 14.585 | |
| Parabolic SAR (0,02-0,02-0,2): | 14.047 | |
| Elder Ray (13): | 0.193 | |
| Super Trend (3,10): | 14.926 | |
| Zig ZAG (10): | 14.765 | |
| VORTEX (21): | 1.1250 | |
| Stochastique (14,3,5): | 82.54 | |
| TEMA (21): | 14.646 | |
| Williams %R (14): | -12.50 | |
| Chande Momentum Oscillator (20): | 0.075 | |
| Repulse (5,40,3): | 1.2030 | |
| ROCnROLL: | 1 | |
| TRIX (15,9): | 0.0330 | |
| Courbe Coppock: | 1.55 |
| MA7: | 14.552 | |
| MA20: | 14.508 | |
| MA50: | 14.418 | |
| MA100: | 14.785 | |
| MAexp7: | 14.613 | |
| MAexp20: | 14.519 | |
| MAexp50: | 14.504 | |
| MAexp100: | 14.561 | |
| Price / MA7: | +2.74% | |
| Price / MA20: | +3.05% | |
| Price / MA50: | +3.69% | |
| Price / MA100: | +1.12% | |
| Price / MAexp7: | +2.31% | |
| Price / MAexp20: | +2.97% | |
| Price / MAexp50: | +3.08% | |
| Price / MAexp100: | +2.67% |
News
The latest news and videos published on METRO AG ST O.N. at the time of the analysis were as follows:
- DGAP-Adhoc: METRO AG sells majority interest in METRO China to Wumei Technology Group
- DGAP-Adhoc: METRO AG confirms far advanced negotiations with Wumei Technology Group regarding a sale of a majority interest in METRO China
- DGAP-Adhoc: METRO AG confirms evaluation of potential efficiency measures
- DGAP-Adhoc: METRO AG: METRO major shareholders Meridian and Beisheim intend to conclude a pooling agreement
- METRO AG: EP Global Commerce's unsolicited offer substantially undervalues METRO
About author

Online


Add a comment
Comments
0 comments on the analysis METRO AG ST O.N. - Daily