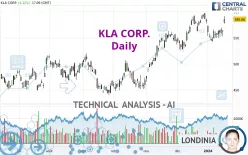
KLA CORP. - Daily - Technical analysis published on 01/18/2024 (GMT)
- 188
- 0
Click here for a new analysis!
- Timeframe : Daily
- - Analysis generated on
- Status : TARGET REACHED

Summary of the analysis

Additional analysis
Quotes
The KLA CORP. rating is 585.66 USD. On the day, this instrument gained +4.12% with the lowest point at 577.00 USD and the highest point at 591.99 USD. The deviation from the price is +1.50% for the low point and -1.07% for the high point.The Central Gaps scanner detects the formation of a bullish gap marking the strong presence of buyers against sellers at the opening. This formed a quotation gap.
Opening Gap UP
Type : Bullish
Timeframe : Openning
Here is a more detailed summary of the historical variations registered by KLA CORP.:
Near a new HIGH record (5 years)
Type : Bullish
Timeframe : Weekly
Near a new HIGH record (1 year)
Type : Bullish
Timeframe : Weekly
New HIGH record (1st january)
Type : Bullish
Timeframe : Weekly
Near a new HIGH record (1 month)
Type : Bullish
Timeframe : Weekly
Technical
Technical analysis of KLA CORP. in Daily shows a strongly overall bullish trend. 92.86% of the signals given by moving averages are bullish. The overall trend is supported by the strong bullish signals from short-term moving averages. The Central Indicators market scanner is currently detecting a bullish signal that could impact this trend:
Bullish price crossover with Moving Average 20
Type : Bullish
Timeframe : Daily
An assessment of technical indicators shows a moderate bullish signal.
Caution: the Central Indicators scanner currently detects an excess:
Williams %R indicator is overbought : over -20
Type : Neutral
Timeframe : Daily
Pivot points : price is over resistance 3
Type : Neutral
Timeframe : Daily
Pivot points : price is over resistance 3
Type : Neutral
Timeframe : Weekly
SuperTrend indicator bullish reversal
Type : Bullish
Timeframe : Daily
Momentum indicator is back over 0
Type : Bullish
Timeframe : Daily
The Central Patterns scanner, which studies chart patterns, resistances and supports, has identified this signal:
Near horizontal resistance
Type : Bearish
Timeframe : Daily
The Central Candlesticks scanner, specialised in Japanese candlesticks, did not identify any signals.
| S3 | S2 | S1 | Price | R1 | |
|---|---|---|---|---|---|
| ProTrendLines | 453.83 | 499.72 | 557.59 | 585.66 | 591.47 |
| Change (%) | -22.51% | -14.67% | -4.79% | - | +0.99% |
| Change | -131.83 | -85.94 | -28.07 | - | +5.81 |
| Level | Intermediate | Major | Intermediate | - | Intermediate |
To determine price objectives, it is also possible to use the pivot points. Here is the price position in relation to pivot points:
| Pivot points | S3 | S2 | S1 | PP | R1 | R2 | R3 |
|---|---|---|---|---|---|---|---|
| Standard | 544.42 | 548.63 | 555.57 | 559.78 | 566.72 | 570.93 | 577.87 |
| Camarilla | 559.43 | 560.46 | 561.48 | 562.50 | 563.52 | 564.54 | 565.57 |
| Woodie | 545.78 | 549.31 | 556.93 | 560.46 | 568.08 | 571.61 | 579.23 |
| Fibonacci | 548.63 | 552.89 | 555.52 | 559.78 | 564.04 | 566.67 | 570.93 |
| Pivot points | S3 | S2 | S1 | PP | R1 | R2 | R3 |
|---|---|---|---|---|---|---|---|
| Standard | 533.95 | 541.40 | 551.00 | 558.45 | 568.05 | 575.50 | 585.10 |
| Camarilla | 555.92 | 557.48 | 559.05 | 560.61 | 562.17 | 563.74 | 565.30 |
| Woodie | 535.04 | 541.94 | 552.09 | 558.99 | 569.14 | 576.04 | 586.19 |
| Fibonacci | 541.40 | 547.91 | 551.93 | 558.45 | 564.96 | 568.98 | 575.50 |
| Pivot points | S3 | S2 | S1 | PP | R1 | R2 | R3 |
|---|---|---|---|---|---|---|---|
| Standard | 469.48 | 498.29 | 539.80 | 568.61 | 610.12 | 638.93 | 680.44 |
| Camarilla | 561.96 | 568.41 | 574.85 | 581.30 | 587.75 | 594.19 | 600.64 |
| Woodie | 475.82 | 501.47 | 546.14 | 571.79 | 616.46 | 642.11 | 686.78 |
| Fibonacci | 498.29 | 525.16 | 541.75 | 568.61 | 595.48 | 612.07 | 638.93 |
Numerical data
The following is the status of the technical indicators and moving averages at the time of publication of this technical analysis:
| RSI (14): | 62.63 | |
| MACD (12,26,9): | 4.1600 | |
| Directional Movement: | 16.84 | |
| AROON (14): | -35.72 | |
| DEMA (21): | 571.18 | |
| Parabolic SAR (0,02-0,02-0,2): | 543.49 | |
| Elder Ray (13): | 18.08 | |
| Super Trend (3,10): | 541.58 | |
| Zig ZAG (10): | 590.03 | |
| VORTEX (21): | 0.8500 | |
| Stochastique (14,3,5): | 55.57 | |
| TEMA (21): | 565.98 | |
| Williams %R (14): | -13.70 | |
| Chande Momentum Oscillator (20): | 8.59 | |
| Repulse (5,40,3): | 3.9400 | |
| ROCnROLL: | 1 | |
| TRIX (15,9): | 0.1000 | |
| Courbe Coppock: | 5.16 |
| MA7: | 564.67 | |
| MA20: | 568.73 | |
| MA50: | 554.11 | |
| MA100: | 513.57 | |
| MAexp7: | 568.32 | |
| MAexp20: | 564.77 | |
| MAexp50: | 548.90 | |
| MAexp100: | 523.30 | |
| Price / MA7: | +3.72% | |
| Price / MA20: | +2.98% | |
| Price / MA50: | +5.69% | |
| Price / MA100: | +14.04% | |
| Price / MAexp7: | +3.05% | |
| Price / MAexp20: | +3.70% | |
| Price / MAexp50: | +6.70% | |
| Price / MAexp100: | +11.92% |
News
The latest news and videos published on KLA CORP. at the time of the analysis were as follows:
- KLA Announces Second Quarter Fiscal Year 2024 Earnings Date
- KLA Announces Upcoming Investor Webcasts
- KLA Declares Regular Cash Dividend
- KLA Corporation Reports Fiscal 2024 First Quarter Results
- KLA Announces First Quarter Fiscal Year 2024 Earnings Date
About author
Online


Add a comment
Comments
0 comments on the analysis KLA CORP. - Daily