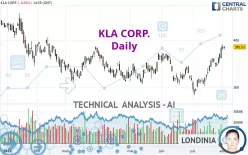
KLA CORP. - Daily - Technical analysis published on 08/02/2022 (GMT)
- 229
- 0
Click here for a new analysis!
- Timeframe : Daily
- - Analysis generated on
- Status : TARGET REACHED

Summary of the analysis

Additional analysis
Quotes
KLA CORP. rating 385.51 USD. The price is lower by -0.03% since the last closing and was traded between 379.30 USD and 386.86 USD over the period. The price is currently at +1.64% from its lowest and -0.35% from its highest.The Central Gaps scanner detects a bearish opening. A small advantage for sellers in the very short term.
Bearish opening
Type : Bearish
Timeframe : Openning
A study of price movements over other periods shows the following variations:
Near a new HIGH record (1 month)
Type : Bullish
Timeframe : Weekly
Technical
A technical analysis in Daily of this KLA CORP. chart shows a strongly bullish trend. 85.71% of the signals given by moving averages are bullish. This strongly bullish trend is supported by the strong bullish signals given by short-term moving averages. The Central Indicators market scanner is currently detecting several bullish signals that could impact this trend:
Moving Average bullish crossovers : MA20 & MA50
Type : Bullish
Timeframe : Daily
Moving Average bullish crossovers : AMA20 & AMA50
Type : Bullish
Timeframe : Daily
In fact, according to the parameters integrated into the Central Analyzer system, 15 technical indicators out of 18 analysed are currently bullish. Caution: the Central Indicators scanner currently detects an excess:
CCI indicator is overbought : over 100
Type : Neutral
Timeframe : Daily
CCI indicator: bearish divergence
Type : Bearish
Timeframe : Daily
RSI indicator: bearish divergence
Type : Bearish
Timeframe : Daily
Williams %R indicator is overbought : over -20
Type : Neutral
Timeframe : Daily
An analysis of the price chart with the Central Patterns scanner (detector of chart patterns and resistances and supports) shows several results that can have an impact on the price change:
Near horizontal resistance
Type : Bearish
Timeframe : Daily
Resistance of channel is broken
Type : Bullish
Timeframe : Daily
The Central Candlesticks scanner currently notes the presence of this pattern in Japanese candlesticks that could mark the end of the short-term trend currently underway:
Doji
Type : Neutral
Timeframe : Daily
| S3 | S2 | S1 | Price | R1 | R2 | R3 | |
|---|---|---|---|---|---|---|---|
| ProTrendLines | 311.09 | 349.85 | 383.09 | 385.51 | 397.14 | 420.05 | 442.32 |
| Change (%) | -19.30% | -9.25% | -0.63% | - | +3.02% | +8.96% | +14.74% |
| Change | -74.42 | -35.66 | -2.42 | - | +11.63 | +34.54 | +56.81 |
| Level | Major | Major | Major | - | Minor | Intermediate | Major |
To determine price objectives, it is also possible to use the pivot points. Here is the price position in relation to pivot points:
| Pivot points | S3 | S2 | S1 | PP | R1 | R2 | R3 |
|---|---|---|---|---|---|---|---|
| Standard | 366.94 | 372.71 | 379.17 | 384.94 | 391.40 | 397.17 | 403.63 |
| Camarilla | 382.28 | 383.40 | 384.52 | 385.64 | 386.76 | 387.88 | 389.00 |
| Woodie | 367.30 | 372.88 | 379.53 | 385.11 | 391.76 | 397.34 | 403.99 |
| Fibonacci | 372.71 | 377.38 | 380.27 | 384.94 | 389.61 | 392.50 | 397.17 |
| Pivot points | S3 | S2 | S1 | PP | R1 | R2 | R3 |
|---|---|---|---|---|---|---|---|
| Standard | 309.74 | 326.37 | 354.95 | 371.58 | 400.16 | 416.79 | 445.37 |
| Camarilla | 371.11 | 375.25 | 379.40 | 383.54 | 387.68 | 391.83 | 395.97 |
| Woodie | 315.73 | 329.36 | 360.94 | 374.57 | 406.15 | 419.78 | 451.36 |
| Fibonacci | 326.37 | 343.64 | 354.31 | 371.58 | 388.85 | 399.52 | 416.79 |
| Pivot points | S3 | S2 | S1 | PP | R1 | R2 | R3 |
|---|---|---|---|---|---|---|---|
| Standard | 209.48 | 246.15 | 314.85 | 351.52 | 420.22 | 456.89 | 525.59 |
| Camarilla | 354.56 | 364.22 | 373.88 | 383.54 | 393.20 | 402.86 | 412.52 |
| Woodie | 225.49 | 254.16 | 330.86 | 359.53 | 436.23 | 464.90 | 541.60 |
| Fibonacci | 246.15 | 286.41 | 311.27 | 351.52 | 391.78 | 416.64 | 456.89 |
Numerical data
The following is the status of the technical indicators and moving averages at the time of publication of this technical analysis:
| RSI (14): | 68.75 | |
| MACD (12,26,9): | 14.2400 | |
| Directional Movement: | 21.69 | |
| AROON (14): | 85.72 | |
| DEMA (21): | 367.17 | |
| Parabolic SAR (0,02-0,02-0,2): | 341.33 | |
| Elder Ray (13): | 23.02 | |
| Super Trend (3,10): | 341.30 | |
| Zig ZAG (10): | 383.23 | |
| VORTEX (21): | 1.2500 | |
| Stochastique (14,3,5): | 93.65 | |
| TEMA (21): | 380.58 | |
| Williams %R (14): | -7.91 | |
| Chande Momentum Oscillator (20): | 57.36 | |
| Repulse (5,40,3): | 6.0500 | |
| ROCnROLL: | 1 | |
| TRIX (15,9): | 0.3600 | |
| Courbe Coppock: | 36.14 |
| MA7: | 368.65 | |
| MA20: | 341.77 | |
| MA50: | 338.47 | |
| MA100: | 338.94 | |
| MAexp7: | 371.81 | |
| MAexp20: | 351.65 | |
| MAexp50: | 341.41 | |
| MAexp100: | 343.19 | |
| Price / MA7: | +4.57% | |
| Price / MA20: | +12.80% | |
| Price / MA50: | +13.90% | |
| Price / MA100: | +13.74% | |
| Price / MAexp7: | +3.68% | |
| Price / MAexp20: | +9.63% | |
| Price / MAexp50: | +12.92% | |
| Price / MAexp100: | +12.33% |
News
Don't forget to follow the news on KLA CORP.. At the time of publication of this analysis, the latest news was as follows:
- KLA CORPORATION REPORTS FISCAL 2022 FOURTH QUARTER AND FULL YEAR RESULTS
- KLA Corporation Announces Pricing of Tender Offer
- KLA Corporation Announces Early Results of Previously Announced Cash Tender Offer
- KLA Announces Fourth Quarter Fiscal Year 2022 Earnings Date
- KLA Corporation Announces $3.0 Billion Accelerated Share Repurchase Agreements
About author
Online


Add a comment
Comments
0 comments on the analysis KLA CORP. - Daily