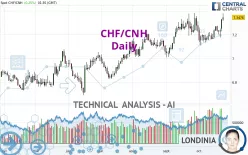
CHF/CNH - Daily - Technical analysis published on 10/25/2022 (GMT)
- 161
- 0
Click here for a new analysis!
- Timeframe : Daily
- - Analysis generated on
- Status : INVALID

Summary of the analysis

Additional analysis
Quotes
The CHF/CNH rating is 7.34778 CNH. The price has increased by +0.26% since the last closing and was traded between 7.31548 CNH and 7.37953 CNH over the period. The price is currently at +0.44% from its lowest and -0.43% from its highest.A bearish opening was detected by the Central Gaps scanner. Sellers are trying to impose a bearish trend in the very short term.
Bearish opening
Type : Bearish
Timeframe : Openning
A study of price movements over other periods shows the following variations:
Near a new HIGH record (5 years)
Type : Bullish
Timeframe : Weekly
Near a new HIGH record (1 year)
Type : Bullish
Timeframe : Weekly
Near a new HIGH record (1st january)
Type : Bullish
Timeframe : Weekly
Near a new LOW record (1 month)
Type : Bearish
Timeframe : Weekly
Abnormal volumes on CHF/CNH were detected by the Central Volumes scanner:
Abnormal volumes
Timeframe : 20 days
Technical
A technical analysis in Daily of this CHF/CNH chart shows a strongly bullish trend. 92.86% of the signals given by moving averages are bullish. This strongly bullish trend is supported by the strong bullish signals given by short-term moving averages. The Central Indicators market scanner is currently detecting a bullish signal that could impact this trend:
Bullish trend reversal : Moving Average 20
Type : Bullish
Timeframe : Daily
The probability of a further increase is high given the direction of the technical indicators.
Caution: the Central Indicators scanner currently detects an excess:
CCI indicator is overbought : over 100
Type : Neutral
Timeframe : Daily
Williams %R indicator is overbought : over -20
Type : Neutral
Timeframe : Daily
Pivot points : price is over resistance 1
Type : Neutral
Timeframe : Weekly
Central Patterns, the market scanner focusing on chart patterns, resistances and supports found these results:
Near horizontal resistance
Type : Bearish
Timeframe : Daily
Resistance of channel is broken
Type : Bullish
Timeframe : Daily
The Central Candlesticks scanner which studies Japanese candlesticks did not detect anything.
| S3 | S2 | S1 | R1 | Price | R2 | R3 | |
|---|---|---|---|---|---|---|---|
| ProTrendLines | 7.06107 | 7.13853 | 7.26100 | 7.34764 | 7.34778 | 7.48485 | 7.70000 |
| Change (%) | -3.90% | -2.85% | -1.18% | +0.00% | - | +1.87% | +4.79% |
| Change | -0.28671 | -0.20925 | -0.08678 | -0.00014 | - | +0.13707 | +0.35222 |
| Level | Minor | Major | Minor | Major | - | Minor | Major |
To determine price objectives, it is also possible to use the pivot points. Here is the price position in relation to pivot points:
| Pivot points | S3 | S2 | S1 | PP | R1 | R2 | R3 |
|---|---|---|---|---|---|---|---|
| Standard | 7.15782 | 7.19339 | 7.26117 | 7.29674 | 7.36452 | 7.40009 | 7.46787 |
| Camarilla | 7.30054 | 7.31001 | 7.31949 | 7.32896 | 7.33843 | 7.34791 | 7.35738 |
| Woodie | 7.17394 | 7.20144 | 7.27729 | 7.30479 | 7.38064 | 7.40814 | 7.48399 |
| Fibonacci | 7.19339 | 7.23287 | 7.25726 | 7.29674 | 7.33622 | 7.36061 | 7.40009 |
| Pivot points | S3 | S2 | S1 | PP | R1 | R2 | R3 |
|---|---|---|---|---|---|---|---|
| Standard | 7.06986 | 7.11917 | 7.17787 | 7.22718 | 7.28588 | 7.33519 | 7.39389 |
| Camarilla | 7.20687 | 7.21677 | 7.22667 | 7.23657 | 7.24647 | 7.25637 | 7.26627 |
| Woodie | 7.07456 | 7.12152 | 7.18257 | 7.22953 | 7.29058 | 7.33754 | 7.39859 |
| Fibonacci | 7.11917 | 7.16043 | 7.18592 | 7.22718 | 7.26844 | 7.29393 | 7.33519 |
| Pivot points | S3 | S2 | S1 | PP | R1 | R2 | R3 |
|---|---|---|---|---|---|---|---|
| Standard | 6.66450 | 6.83785 | 7.03637 | 7.20972 | 7.40824 | 7.58159 | 7.78011 |
| Camarilla | 7.13262 | 7.16670 | 7.20079 | 7.23488 | 7.26897 | 7.30306 | 7.33714 |
| Woodie | 6.67708 | 6.84414 | 7.04895 | 7.21601 | 7.42082 | 7.58788 | 7.79269 |
| Fibonacci | 6.83785 | 6.97991 | 7.06767 | 7.20972 | 7.35178 | 7.43954 | 7.58159 |
Numerical data
The following are the details of the technical indicators and moving averages that were collected to generate this technical analysis:
| RSI (14): | 65.11 | |
| MACD (12,26,9): | 0.0258 | |
| Directional Movement: | 13.12415 | |
| AROON (14): | 85.71429 | |
| DEMA (21): | 7.26749 | |
| Parabolic SAR (0,02-0,02-0,2): | 7.14493 | |
| Elder Ray (13): | 0.09602 | |
| Super Trend (3,10): | 7.14923 | |
| Zig ZAG (10): | 7.35502 | |
| VORTEX (21): | 1.0771 | |
| Stochastique (14,3,5): | 87.55 | |
| TEMA (21): | 7.27243 | |
| Williams %R (14): | -11.30 | |
| Chande Momentum Oscillator (20): | 0.18268 | |
| Repulse (5,40,3): | 1.6038 | |
| ROCnROLL: | 1 | |
| TRIX (15,9): | 0.0201 | |
| Courbe Coppock: | 1.74 |
| MA7: | 7.26913 | |
| MA20: | 7.22463 | |
| MA50: | 7.19493 | |
| MA100: | 7.08475 | |
| MAexp7: | 7.27542 | |
| MAexp20: | 7.23728 | |
| MAexp50: | 7.18901 | |
| MAexp100: | 7.11426 | |
| Price / MA7: | +1.08% | |
| Price / MA20: | +1.70% | |
| Price / MA50: | +2.12% | |
| Price / MA100: | +3.71% | |
| Price / MAexp7: | +1.00% | |
| Price / MAexp20: | +1.53% | |
| Price / MAexp50: | +2.22% | |
| Price / MAexp100: | +3.29% |
About author
Online


Add a comment
Comments
0 comments on the analysis CHF/CNH - Daily