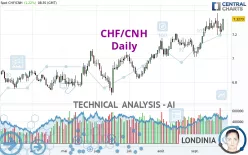
CHF/CNH - Daily - Technical analysis published on 09/28/2022 (GMT)
- 121
- 0
Click here for a new analysis!
- Timeframe : Daily
- - Analysis generated on
- Status : INVALID

Summary of the analysis

Additional analysis
Quotes
CHF/CNH rating 7.32730 CNH. The price registered an increase of +1.22% on the session and was between 7.23012 CNH and 7.33036 CNH. This implies that the price is at +1.34% from its lowest and at -0.04% from its highest.The Central Gaps scanner detects a bearish opening marking the presence of sellers ahead of buyers at the opening but not sufficiently marked to allow the price to register a quotation gap.
Bearish opening
Type : Bearish
Timeframe : Openning
A study of price movements over other periods shows the following variations:
Near a new HIGH record (1 year)
Type : Bullish
Timeframe : Weekly
Near a new HIGH record (1st january)
Type : Bullish
Timeframe : Weekly
Near a new LOW record (1 month)
Type : Bearish
Timeframe : Weekly
Technical
Technical analysis of this Daily chart of CHF/CNH indicates that the overall trend is strongly bullish. 92.86% of the signals given by moving averages are bullish. This strongly bullish trend is supported by the strong bullish signals given by short-term moving averages. The Central Indicators scanner does not detect any result on moving averages that would impact this trend.
The probability of a further increase is high given the direction of the technical indicators.
Other results related to technical indicators were also found by the Central Indicators scanner:
Pivot points : price is over resistance 2
Type : Neutral
Timeframe : Daily
Price is back over the pivot point
Type : Bullish
Timeframe : Weekly
Williams %R indicator is back over -50
Type : Bullish
Timeframe : Daily
The Central Patterns scanner, which studies chart patterns, resistances and supports, has identified this signal:
Near resistance of channel
Type : Bearish
Timeframe : Daily
The Central Candlesticks scanner, specialised in Japanese candlesticks, did not identify any signals.
| S3 | S2 | S1 | Price | R1 | R2 | R3 | |
|---|---|---|---|---|---|---|---|
| ProTrendLines | 7.13853 | 7.20198 | 7.26100 | 7.32730 | 7.34764 | 7.48485 | 7.70000 |
| Change (%) | -2.58% | -1.71% | -0.90% | - | +0.28% | +2.15% | +5.09% |
| Change | -0.18877 | -0.12532 | -0.06630 | - | +0.02034 | +0.15755 | +0.37270 |
| Level | Major | Intermediate | Major | - | Major | Minor | Major |
Pivot points can also be used to set your price objectives. Here is the price situation in relation to pivot points:
| Pivot points | S3 | S2 | S1 | PP | R1 | R2 | R3 |
|---|---|---|---|---|---|---|---|
| Standard | 7.13966 | 7.17786 | 7.20831 | 7.24651 | 7.27696 | 7.31516 | 7.34561 |
| Camarilla | 7.21989 | 7.22618 | 7.23248 | 7.23877 | 7.24506 | 7.25136 | 7.25765 |
| Woodie | 7.13580 | 7.17592 | 7.20445 | 7.24457 | 7.27310 | 7.31322 | 7.34175 |
| Fibonacci | 7.17786 | 7.20408 | 7.22028 | 7.24651 | 7.27273 | 7.28893 | 7.31516 |
| Pivot points | S3 | S2 | S1 | PP | R1 | R2 | R3 |
|---|---|---|---|---|---|---|---|
| Standard | 6.99664 | 7.09488 | 7.18126 | 7.27950 | 7.36588 | 7.46412 | 7.55050 |
| Camarilla | 7.21687 | 7.23379 | 7.25072 | 7.26764 | 7.28456 | 7.30149 | 7.31841 |
| Woodie | 6.99071 | 7.09192 | 7.17533 | 7.27654 | 7.35995 | 7.46116 | 7.54457 |
| Fibonacci | 7.09488 | 7.16541 | 7.20898 | 7.27950 | 7.35003 | 7.39360 | 7.46412 |
| Pivot points | S3 | S2 | S1 | PP | R1 | R2 | R3 |
|---|---|---|---|---|---|---|---|
| Standard | 6.78262 | 6.89723 | 6.97806 | 7.09267 | 7.17350 | 7.28811 | 7.36894 |
| Camarilla | 7.00514 | 7.02306 | 7.04098 | 7.05889 | 7.07681 | 7.09472 | 7.11264 |
| Woodie | 6.76573 | 6.88879 | 6.96117 | 7.08423 | 7.15661 | 7.27967 | 7.35205 |
| Fibonacci | 6.89723 | 6.97189 | 7.01801 | 7.09267 | 7.16733 | 7.21345 | 7.28811 |
Numerical data
The following are the details of the technical indicators and moving averages that were collected to generate this technical analysis:
| RSI (14): | 63.65 | |
| MACD (12,26,9): | 0.0452 | |
| Directional Movement: | 8.60955 | |
| AROON (14): | 71.42857 | |
| DEMA (21): | 7.28827 | |
| Parabolic SAR (0,02-0,02-0,2): | 7.20039 | |
| Elder Ray (13): | 0.02913 | |
| Super Trend (3,10): | 7.14140 | |
| Zig ZAG (10): | 7.32389 | |
| VORTEX (21): | 1.0916 | |
| Stochastique (14,3,5): | 56.43 | |
| TEMA (21): | 7.29750 | |
| Williams %R (14): | -25.10 | |
| Chande Momentum Oscillator (20): | 0.06792 | |
| Repulse (5,40,3): | 1.0339 | |
| ROCnROLL: | 1 | |
| TRIX (15,9): | 0.0922 | |
| Courbe Coppock: | 3.65 |
| MA7: | 7.27415 | |
| MA20: | 7.21476 | |
| MA50: | 7.14361 | |
| MA100: | 7.02486 | |
| MAexp7: | 7.27026 | |
| MAexp20: | 7.22743 | |
| MAexp50: | 7.14615 | |
| MAexp100: | 7.06359 | |
| Price / MA7: | +0.73% | |
| Price / MA20: | +1.56% | |
| Price / MA50: | +2.57% | |
| Price / MA100: | +4.31% | |
| Price / MAexp7: | +0.78% | |
| Price / MAexp20: | +1.38% | |
| Price / MAexp50: | +2.53% | |
| Price / MAexp100: | +3.73% |
About author
Online


Add a comment
Comments
0 comments on the analysis CHF/CNH - Daily