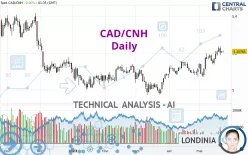
CAD/CNH - Daily - Technical analysis published on 05/22/2023 (GMT)
- 229
- 0
Click here for a new analysis!
- Timeframe : Daily
- - Analysis generated on
- Status : TARGET REACHED

Summary of the analysis

Additional analysis
Quotes
The CAD/CNH rating is 5.20755 CNH. The price has increased by +0.00% since the last closing with the lowest point at 5.20074 CNH and the highest point at 5.21042 CNH. The deviation from the price is +0.13% for the low point and -0.06% for the high point.The Central Gaps scanner detects a bullish opening marking the presence of buyers ahead of sellers at the opening but not sufficiently marked to allow the price to register a quotation gap.
Bullish opening
Type : Bullish
Timeframe : Openning
So that you have an overall view of the price change, here is a table showing the variations over several periods:
Near a new HIGH record (5 years)
Type : Bullish
Timeframe : Weekly
Near a new LOW record (1 year)
Type : Bearish
Timeframe : Weekly
Near a new LOW record (1st january)
Type : Bearish
Timeframe : Weekly
Near a new LOW record (1 month)
Type : Bearish
Timeframe : Weekly
Technical
A technical analysis in Daily of this CAD/CNH chart shows a strongly bullish trend. The signals given by the moving averages are 92.86% bullish. This strong bullish trend is confirmed by the strong signals currently being given by short-term moving averages. There is no crossing of moving average by the price or crossing of moving averages between themselves.
In fact, according to the parameters integrated into the Central Analyzer system, 12 technical indicators out of 18 analysed are currently bullish. The Central Indicators scanner found this result concerning these indicators:
Pivot points : price is under support 1
Type : Neutral
Timeframe : Daily
The Central Patterns scanner, which studies chart patterns, resistances and supports, has identified these signals:
Near horizontal resistance
Type : Bearish
Timeframe : Daily
Resistance of channel is broken
Type : Bullish
Timeframe : Daily
Central Candlesticks, the scanner specialised in Japanese candlesticks, detects a bearish signal that could support the hypothesis of a small drop in the very short term:
Bearish engulfing lines
Type : Bearish
Timeframe : Daily
| S3 | S2 | S1 | Price | R1 | R2 | R3 | |
|---|---|---|---|---|---|---|---|
| ProTrendLines | 5.07905 | 5.15090 | 5.18485 | 5.20755 | 5.27970 | 5.33866 | 5.41571 |
| Change (%) | -2.47% | -1.09% | -0.44% | - | +1.39% | +2.52% | +4.00% |
| Change | -0.12850 | -0.05665 | -0.02270 | - | +0.07215 | +0.13111 | +0.20816 |
| Level | Intermediate | Major | Major | - | Intermediate | Major | Major |
Attention could also be paid to pivot points to set price objectives:
| Pivot points | S3 | S2 | S1 | PP | R1 | R2 | R3 |
|---|---|---|---|---|---|---|---|
| Standard | 5.19773 | 5.19998 | 5.20377 | 5.20602 | 5.20981 | 5.21206 | 5.21585 |
| Camarilla | 5.20589 | 5.20644 | 5.20700 | 5.20755 | 5.20810 | 5.20866 | 5.20921 |
| Woodie | 5.19849 | 5.20037 | 5.20453 | 5.20641 | 5.21057 | 5.21245 | 5.21661 |
| Fibonacci | 5.19998 | 5.20229 | 5.20372 | 5.20602 | 5.20833 | 5.20976 | 5.21206 |
| Pivot points | S3 | S2 | S1 | PP | R1 | R2 | R3 |
|---|---|---|---|---|---|---|---|
| Standard | 5.04869 | 5.09323 | 5.14753 | 5.19207 | 5.24637 | 5.29091 | 5.34521 |
| Camarilla | 5.17466 | 5.18372 | 5.19278 | 5.20184 | 5.21090 | 5.21996 | 5.22902 |
| Woodie | 5.05358 | 5.09567 | 5.15242 | 5.19451 | 5.25126 | 5.29335 | 5.35010 |
| Fibonacci | 5.09323 | 5.13098 | 5.15431 | 5.19207 | 5.22982 | 5.25315 | 5.29091 |
| Pivot points | S3 | S2 | S1 | PP | R1 | R2 | R3 |
|---|---|---|---|---|---|---|---|
| Standard | 4.98904 | 5.03074 | 5.07121 | 5.11291 | 5.15338 | 5.19508 | 5.23555 |
| Camarilla | 5.08907 | 5.09661 | 5.10414 | 5.11167 | 5.11920 | 5.12674 | 5.13427 |
| Woodie | 4.98842 | 5.03043 | 5.07059 | 5.11260 | 5.15276 | 5.19477 | 5.23493 |
| Fibonacci | 5.03074 | 5.06213 | 5.08152 | 5.11291 | 5.14430 | 5.16369 | 5.19508 |
Numerical data
The following is the status of the technical indicators and moving averages at the time of publication of this technical analysis:
| RSI (14): | 61.51 | |
| MACD (12,26,9): | 0.0277 | |
| Directional Movement: | 14.52768 | |
| AROON (14): | 85.71429 | |
| DEMA (21): | 5.20211 | |
| Parabolic SAR (0,02-0,02-0,2): | 5.15135 | |
| Elder Ray (13): | 0.02258 | |
| Super Trend (3,10): | 5.12264 | |
| Zig ZAG (10): | 5.20197 | |
| VORTEX (21): | 1.1620 | |
| Stochastique (14,3,5): | 80.16 | |
| TEMA (21): | 5.21387 | |
| Williams %R (14): | -21.24 | |
| Chande Momentum Oscillator (20): | 0.02737 | |
| Repulse (5,40,3): | -0.0543 | |
| ROCnROLL: | 1 | |
| TRIX (15,9): | 0.0674 | |
| Courbe Coppock: | 3.31 |
| MA7: | 5.20085 | |
| MA20: | 5.15706 | |
| MA50: | 5.11053 | |
| MA100: | 5.09034 | |
| MAexp7: | 5.19802 | |
| MAexp20: | 5.16744 | |
| MAexp50: | 5.13215 | |
| MAexp100: | 5.12648 | |
| Price / MA7: | +0.13% | |
| Price / MA20: | +0.98% | |
| Price / MA50: | +1.90% | |
| Price / MA100: | +2.30% | |
| Price / MAexp7: | +0.18% | |
| Price / MAexp20: | +0.78% | |
| Price / MAexp50: | +1.47% | |
| Price / MAexp100: | +1.58% |
About author
Online


Add a comment
Comments
0 comments on the analysis CAD/CNH - Daily