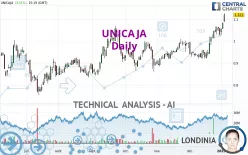
UNICAJA - Daily - Technical analysis published on 01/04/2023 (GMT)
- 234
- 0
Click here for a new analysis!
- Timeframe : Daily
- - Analysis generated on
- Status : TARGET REACHED

Summary of the analysis

Additional analysis
Quotes
UNICAJA rating 1.1210 EUR. On the day, this instrument gained +3.51% with the lowest point at 1.0890 EUR and the highest point at 1.1280 EUR. The deviation from the price is +2.94% for the low point and -0.62% for the high point.The Central Gaps scanner detects a bullish gap which is a sign that buyers have taken the lead in the very short term.
Opening Gap UP
Type : Bullish
Timeframe : Openning
So that you have an overall view of the price change, here is a table showing the variations over several periods:
New HIGH record (1 year)
Type : Bullish
Timeframe : Weekly
New HIGH record (1st january)
Type : Bullish
Timeframe : Weekly
New HIGH record (1 month)
Type : Bullish
Timeframe : Weekly
Technical
Technical analysis of this Daily chart of UNICAJA indicates that the overall trend is strongly bullish. 92.86% of the signals given by moving averages are bullish. The overall trend is supported by the strong bullish signals from short-term moving averages. There is no crossing of moving average by the price or crossing of moving averages between themselves.
In fact, 17 technical indicators on 18 studied are currently bullish. Caution: the Central Indicators scanner currently detects an excess:
RSI indicator is overbought : over 70
Type : Neutral
Timeframe : Daily
CCI indicator is overbought : over 100
Type : Neutral
Timeframe : Daily
Williams %R indicator is overbought : over -20
Type : Neutral
Timeframe : Daily
Pivot points : price is over resistance 3
Type : Neutral
Timeframe : Daily
Pivot points : price is over resistance 3
Type : Neutral
Timeframe : Weekly
Central Patterns, the market scanner focusing on chart patterns, resistances and supports found this result:
Near horizontal support
Type : Bullish
Timeframe : Daily
For a small rebound in the very short term, the Central Candlesticks scanner currently notes the presence of this bullish pattern in Japanese candlesticks:
Upside gap
Type : Bullish
Timeframe : Daily
| S3 | S2 | S1 | Price | |
|---|---|---|---|---|
| ProTrendLines | 0.9462 | 0.9922 | 1.0570 | 1.1210 |
| Change (%) | -15.59% | -11.49% | -5.71% | - |
| Change | -0.1748 | -0.1288 | -0.0640 | - |
| Level | Major | Intermediate | Major | - |
To determine price objectives, it is also possible to use the pivot points. Here is the price position in relation to pivot points:
| Pivot points | S3 | S2 | S1 | PP | R1 | R2 | R3 |
|---|---|---|---|---|---|---|---|
| Standard | 1.0353 | 1.0457 | 1.0643 | 1.0747 | 1.0933 | 1.1037 | 1.1223 |
| Camarilla | 1.0750 | 1.0777 | 1.0803 | 1.0830 | 1.0857 | 1.0883 | 1.0910 |
| Woodie | 1.0395 | 1.0478 | 1.0685 | 1.0768 | 1.0975 | 1.1058 | 1.1265 |
| Fibonacci | 1.0457 | 1.0567 | 1.0636 | 1.0747 | 1.0857 | 1.0926 | 1.1037 |
| Pivot points | S3 | S2 | S1 | PP | R1 | R2 | R3 |
|---|---|---|---|---|---|---|---|
| Standard | 0.9780 | 1.0030 | 1.0170 | 1.0420 | 1.0560 | 1.0810 | 1.0950 |
| Camarilla | 1.0203 | 1.0239 | 1.0274 | 1.0310 | 1.0346 | 1.0382 | 1.0417 |
| Woodie | 0.9725 | 1.0003 | 1.0115 | 1.0393 | 1.0505 | 1.0783 | 1.0895 |
| Fibonacci | 1.0030 | 1.0179 | 1.0271 | 1.0420 | 1.0569 | 1.0661 | 1.0810 |
| Pivot points | S3 | S2 | S1 | PP | R1 | R2 | R3 |
|---|---|---|---|---|---|---|---|
| Standard | 0.7980 | 0.8590 | 0.9450 | 1.0060 | 1.0920 | 1.1530 | 1.2390 |
| Camarilla | 0.9906 | 1.0041 | 1.0175 | 1.0310 | 1.0445 | 1.0580 | 1.0714 |
| Woodie | 0.8105 | 0.8653 | 0.9575 | 1.0123 | 1.1045 | 1.1593 | 1.2515 |
| Fibonacci | 0.8590 | 0.9152 | 0.9499 | 1.0060 | 1.0622 | 1.0969 | 1.1530 |
Numerical data
The following is the status of the technical indicators and moving averages at the time of publication of this technical analysis:
| RSI (14): | 75.53 | |
| MACD (12,26,9): | 0.0354 | |
| Directional Movement: | 22.4021 | |
| AROON (14): | 92.8571 | |
| DEMA (21): | 1.0611 | |
| Parabolic SAR (0,02-0,02-0,2): | 0.9908 | |
| Elder Ray (13): | 0.0680 | |
| Super Trend (3,10): | 1.0155 | |
| Zig ZAG (10): | 1.1240 | |
| VORTEX (21): | 1.2116 | |
| Stochastique (14,3,5): | 96.30 | |
| TEMA (21): | 1.0852 | |
| Williams %R (14): | -2.40 | |
| Chande Momentum Oscillator (20): | 0.1810 | |
| Repulse (5,40,3): | 6.4955 | |
| ROCnROLL: | 1 | |
| TRIX (15,9): | 0.3360 | |
| Courbe Coppock: | 26.81 |
| MA7: | 1.0650 | |
| MA20: | 0.9987 | |
| MA50: | 0.9671 | |
| MA100: | 0.9489 | |
| MAexp7: | 1.0672 | |
| MAexp20: | 1.0205 | |
| MAexp50: | 0.9827 | |
| MAexp100: | 0.9564 | |
| Price / MA7: | +5.26% | |
| Price / MA20: | +12.25% | |
| Price / MA50: | +15.91% | |
| Price / MA100: | +18.14% | |
| Price / MAexp7: | +5.04% | |
| Price / MAexp20: | +9.85% | |
| Price / MAexp50: | +14.07% | |
| Price / MAexp100: | +17.21% |
About author
Online


Add a comment
Comments
0 comments on the analysis UNICAJA - Daily