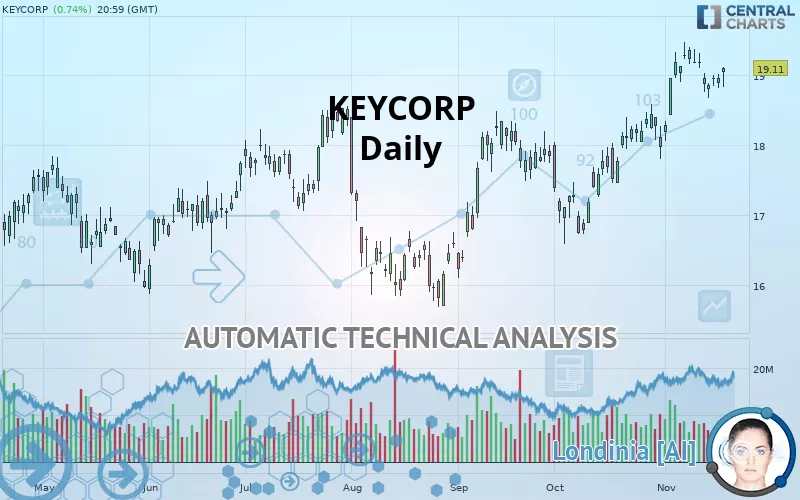
KEYCORP - Daily - Technical analysis published on 11/20/2019 (GMT)
- 277
- 0
- Who voted?
Click here for a new analysis!
- Timeframe : Daily
- - Analysis generated on
- Status : TARGET REACHED
Summary of the analysis

Additional analysis
Quotes
KEYCORP rating 19.11 USD. The price has increased by +0.74% since the last closing and was traded between 18.84 USD and 19.12 USD over the period. The price is currently at +1.43% from its lowest and -0.05% from its highest.A bullish gap was detected at the opening by the Central Gaps scanner. There are a lot of buyers and they have the upper hand in the very short term.
Opening Gap UP
Type : Bullish
Timeframe : Openning
So that you have an overall view of the price change, here is a table showing the variations over several periods:
Near a new HIGH record (1 year)
Type : Bullish
Timeframe : Weekly
Near a new HIGH record (1st january)
Type : Bullish
Timeframe : Weekly
Near a new HIGH record (1 month)
Type : Bullish
Timeframe : Weekly
Technical
A technical analysis in Daily of this KEYCORP chart shows a strongly bullish trend. 92.86% of the signals given by moving averages are bullish. The overall trend is supported by the strong bullish signals from short-term moving averages. There is no crossing of moving average by the price or crossing of moving averages between themselves.
In fact, according to the parameters integrated into the Central Analyzer system, only 8 technical indicators out of 18 analysed are currently bullish. Central Indicators, the scanner specialised in technical indicators, has identified these signals:
Pivot points : price is over resistance 1
Type : Neutral
Timeframe : Daily
Price is back under the pivot point
Type : Bearish
Timeframe : Weekly
An analysis of the price chart with the Central Patterns scanner (detector of chart patterns and resistances and supports) shows a result that can have an impact on the price change:
Near horizontal support
Type : Bullish
Timeframe : Daily
The Central Candlesticks scanner, specialised in Japanese candlesticks, did not identify any signals.
| S3 | S2 | S1 | Price | R1 | R2 | R3 | |
|---|---|---|---|---|---|---|---|
| ProTrendLines | 16.56 | 17.97 | 18.89 | 19.11 | 19.36 | 20.65 | 22.07 |
| Change (%) | -13.34% | -5.97% | -1.15% | - | +1.31% | +8.06% | +15.49% |
| Change | -2.55 | -1.14 | -0.22 | - | +0.25 | +1.54 | +2.96 |
| Level | Major | Major | Intermediate | - | Major | Minor | Major |
Attention could also be paid to pivot points to set price objectives:
| Pivot points | S3 | S2 | S1 | PP | R1 | R2 | R3 |
|---|---|---|---|---|---|---|---|
| Standard | 18.65 | 18.74 | 18.85 | 18.94 | 19.05 | 19.14 | 19.25 |
| Camarilla | 18.92 | 18.93 | 18.95 | 18.97 | 18.99 | 19.01 | 19.03 |
| Woodie | 18.67 | 18.75 | 18.87 | 18.95 | 19.07 | 19.15 | 19.27 |
| Fibonacci | 18.74 | 18.81 | 18.86 | 18.94 | 19.01 | 19.06 | 19.14 |
| Pivot points | S3 | S2 | S1 | PP | R1 | R2 | R3 |
|---|---|---|---|---|---|---|---|
| Standard | 17.94 | 18.31 | 18.64 | 19.01 | 19.34 | 19.71 | 20.04 |
| Camarilla | 18.78 | 18.84 | 18.91 | 18.97 | 19.03 | 19.10 | 19.16 |
| Woodie | 17.92 | 18.30 | 18.62 | 19.00 | 19.32 | 19.70 | 20.02 |
| Fibonacci | 18.31 | 18.58 | 18.74 | 19.01 | 19.28 | 19.44 | 19.71 |
| Pivot points | S3 | S2 | S1 | PP | R1 | R2 | R3 |
|---|---|---|---|---|---|---|---|
| Standard | 14.84 | 15.71 | 16.84 | 17.72 | 18.85 | 19.72 | 20.85 |
| Camarilla | 17.42 | 17.60 | 17.79 | 17.97 | 18.15 | 18.34 | 18.52 |
| Woodie | 14.96 | 15.78 | 16.97 | 17.78 | 18.97 | 19.79 | 20.98 |
| Fibonacci | 15.71 | 16.48 | 16.95 | 17.72 | 18.48 | 18.96 | 19.72 |
Numerical data
The following is the status of technical indicators and moving averages registered at the time this technical analysis was created:
| RSI (14): | 63.01 | |
| MACD (12,26,9): | 0.3300 | |
| Directional Movement: | 11.03 | |
| AROON (14): | 35.72 | |
| DEMA (21): | 19.19 | |
| Parabolic SAR (0,02-0,02-0,2): | 18.54 | |
| Elder Ray (13): | 0.07 | |
| Super Trend (3,10): | 18.20 | |
| Zig ZAG (10): | 19.11 | |
| VORTEX (21): | 1.0500 | |
| Stochastique (14,3,5): | 72.42 | |
| TEMA (21): | 19.26 | |
| Williams %R (14): | -22.02 | |
| Chande Momentum Oscillator (20): | 0.82 | |
| Repulse (5,40,3): | 1.8900 | |
| ROCnROLL: | 1 | |
| TRIX (15,9): | 0.3000 | |
| Courbe Coppock: | 8.12 |
| MA7: | 19.03 | |
| MA20: | 18.76 | |
| MA50: | 18.11 | |
| MA100: | 17.53 | |
| MAexp7: | 19.01 | |
| MAexp20: | 18.73 | |
| MAexp50: | 18.17 | |
| MAexp100: | 17.69 | |
| Price / MA7: | +0.42% | |
| Price / MA20: | +1.87% | |
| Price / MA50: | +5.52% | |
| Price / MA100: | +9.01% | |
| Price / MAexp7: | +0.53% | |
| Price / MAexp20: | +2.03% | |
| Price / MAexp50: | +5.17% | |
| Price / MAexp100: | +8.03% |
News
The last news published on KEYCORP at the time of the generation of this analysis was as follows:
- KeyCorp Fourth Quarter 2019 Earnings Release Date And Conference Call
- KeyBank Institutional Advisors Named 'OCIO of the Year' and 'Fund of the Year' at the 2019 Institutional Asset Management Awards
- KeyBank's Cashback Credit Card Puts Money Back in Shoppers' Wallets This Holiday Season
- KeyCorp Lowers Its Prime Lending Rate To 4.75 Percent
- Women Business Owners Getting a Helping Hand from Key4Women
About author

Online


Add a comment
Comments
0 comments on the analysis KEYCORP - Daily