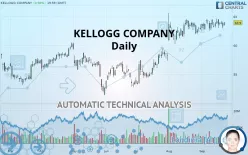
KELLANOVA - Daily - Technical analysis published on 09/25/2019 (GMT)
- 345
- 0
- Who voted?
Click here for a new analysis!
- Timeframe : Daily
- - Analysis generated on
- Status : TARGET REACHED

Summary of the analysis

Additional analysis
Quotes
KELLOGG COMPANY rating 63.90 USD. The price registered an increase of +0.98% on the session and was traded between 63.38 USD and 64.03 USD over the period. The price is currently at +0.82% from its lowest and -0.20% from its highest.A bullish opening was detected by the Central Gaps scanner. Buyers are trying to impose a bullish momentum in the very short term.
Bullish opening
Type : Bullish
Timeframe : Openning
A study of price movements over other periods shows the following variations:
Near a new HIGH record (1st january)
Type : Bullish
Timeframe : Weekly
Technical
A technical analysis in Daily of this KELLOGG COMPANY chart shows a strongly bullish trend. 92.86% of the signals given by moving averages are bullish. The overall trend is supported by the strong bullish signals from short-term moving averages. The Central Indicators scanner detects a bearish signal on moving averages that could impact this trend:
Bearish price crossover with Moving Average 20
Type : Bearish
Timeframe : Daily
An assessment of technical indicators does not currently provide any relevant information on the direction of future price movements.
Caution: the Central Indicators scanner currently detects an excess:
Williams %R indicator is overbought : over -20
Type : Neutral
Timeframe : Daily
Parabolic SAR indicator bearish reversal
Type : Bearish
Timeframe : Daily
Price is back under the pivot point
Type : Bearish
Timeframe : Daily
Williams %R indicator is back under -50
Type : Bearish
Timeframe : Daily
An analysis of the price chart with the Central Patterns scanner (detector of chart patterns and resistances and supports) shows a result that can have an impact on the price change:
Near support of channel
Type : Bullish
Timeframe : Daily
The Central Candlesticks scanner which studies Japanese candlesticks did not detect anything.
| S3 | S2 | S1 | Price | R1 | R2 | R3 | |
|---|---|---|---|---|---|---|---|
| ProTrendLines | 57.00 | 60.30 | 62.10 | 63.90 | 64.21 | 65.34 | 69.74 |
| Change (%) | -10.80% | -5.63% | -2.82% | - | +0.49% | +2.25% | +9.14% |
| Change | -6.90 | -3.60 | -1.80 | - | +0.31 | +1.44 | +5.84 |
| Level | Major | Major | Major | - | Major | Minor | Intermediate |
Attention could also be paid to pivot points to set price objectives:
| Pivot points | S3 | S2 | S1 | PP | R1 | R2 | R3 |
|---|---|---|---|---|---|---|---|
| Standard | 61.58 | 62.24 | 62.76 | 63.41 | 63.94 | 64.59 | 65.11 |
| Camarilla | 62.96 | 63.06 | 63.17 | 63.28 | 63.39 | 63.50 | 63.60 |
| Woodie | 61.51 | 62.20 | 62.69 | 63.38 | 63.87 | 64.56 | 65.05 |
| Fibonacci | 62.24 | 62.69 | 62.96 | 63.41 | 63.86 | 64.14 | 64.59 |
| Pivot points | S3 | S2 | S1 | PP | R1 | R2 | R3 |
|---|---|---|---|---|---|---|---|
| Standard | 61.29 | 62.12 | 62.93 | 63.76 | 64.57 | 65.40 | 66.21 |
| Camarilla | 63.28 | 63.43 | 63.58 | 63.73 | 63.88 | 64.03 | 64.18 |
| Woodie | 61.27 | 62.12 | 62.91 | 63.76 | 64.55 | 65.40 | 66.19 |
| Fibonacci | 62.12 | 62.75 | 63.14 | 63.76 | 64.39 | 64.78 | 65.40 |
| Pivot points | S3 | S2 | S1 | PP | R1 | R2 | R3 |
|---|---|---|---|---|---|---|---|
| Standard | 54.61 | 57.13 | 59.97 | 62.48 | 65.32 | 67.83 | 70.67 |
| Camarilla | 61.33 | 61.82 | 62.31 | 62.80 | 63.29 | 63.78 | 64.27 |
| Woodie | 54.77 | 57.21 | 60.12 | 62.56 | 65.48 | 67.91 | 70.83 |
| Fibonacci | 57.13 | 59.17 | 60.44 | 62.48 | 64.53 | 65.79 | 67.83 |
Numerical data
The following is the status of technical indicators and moving averages registered at the time this technical analysis was created:
| RSI (14): | 57.10 | |
| MACD (12,26,9): | 0.6300 | |
| Directional Movement: | -1.13 | |
| AROON (14): | 35.72 | |
| DEMA (21): | 64.25 | |
| Parabolic SAR (0,02-0,02-0,2): | 64.57 | |
| Elder Ray (13): | 0.15 | |
| Super Trend (3,10): | 60.74 | |
| Zig ZAG (10): | 63.90 | |
| VORTEX (21): | 0.9900 | |
| Stochastique (14,3,5): | 54.13 | |
| TEMA (21): | 63.83 | |
| Williams %R (14): | -33.33 | |
| Chande Momentum Oscillator (20): | -0.32 | |
| Repulse (5,40,3): | -0.3500 | |
| ROCnROLL: | 1 | |
| TRIX (15,9): | 0.1800 | |
| Courbe Coppock: | 2.00 |
| MA7: | 63.74 | |
| MA20: | 63.35 | |
| MA50: | 61.44 | |
| MA100: | 58.14 | |
| MAexp7: | 63.67 | |
| MAexp20: | 63.28 | |
| MAexp50: | 61.51 | |
| MAexp100: | 59.69 | |
| Price / MA7: | +0.25% | |
| Price / MA20: | +0.87% | |
| Price / MA50: | +4.00% | |
| Price / MA100: | +9.91% | |
| Price / MAexp7: | +0.36% | |
| Price / MAexp20: | +0.98% | |
| Price / MAexp50: | +3.89% | |
| Price / MAexp100: | +7.05% |
News
The latest news and videos published on KELLOGG COMPANY at the time of the analysis were as follows:
- The Aspen Institute's Project Play And Kellogg Company's Mission Tiger Team Up To Help Save Middle School Sports
- StayinFront Expands its Partnership with Kellogg’s® Australia and New Zealand Deployment of TouchCG Advanced
- Introducing Incogmeato™ by MorningStar Farms®, The Newest Addition to Kellogg Company's Plant-Based Portfolio
- Overwatch League™ Announces Multi-Year Deal with Kellogg® Cheez-It® and Pringles®
- Kellogg, No Kid Hungry partner once again to expand school breakfast programs
About author

Online


Add a comment
Comments
0 comments on the analysis KELLANOVA - Daily