KBC - Daily - Technical analysis published on 02/08/2024 (GMT)
- 126
- 0
Click here for a new analysis!
- Timeframe : Daily
- - Analysis generated on
- Status : TARGET REACHED

Summary of the analysis

Additional analysis
Quotes
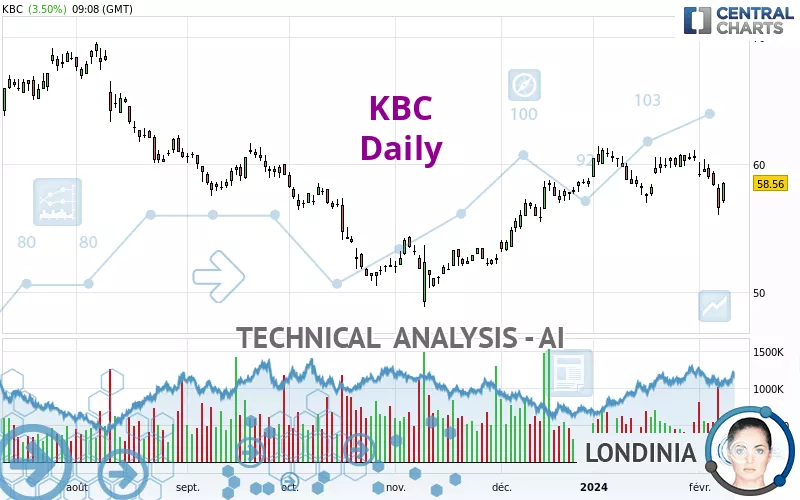
KBC rating 58.56 EUR. On the day, this instrument gained +3.50% and was traded between 56.94 EUR and 58.60 EUR over the period. The price is currently at +2.85% from its lowest and -0.07% from its highest.The Central Gaps scanner detects a bullish opening marking the presence of buyers ahead of sellers at the opening but not sufficiently marked to allow the price to register a quotation gap.
Bullish opening
Type : Bullish
Timeframe : Openning
A study of price movements over other periods shows the following variations:
Near a new HIGH record (1st january)
Type : Bullish
Timeframe : Weekly
Near a new HIGH record (1 month)
Type : Bullish
Timeframe : Weekly
Technical
Technical analysis of this Daily chart of KBC indicates that the overall trend is bullish. The signals given by moving averages are 71.43% bullish. This bullish trend could slow down given the neutral signals currently being given by short-term moving averages. An assessment of moving averages reveals several bullish signals that could impact this trend:
Bullish price crossover with Moving Average 50
Type : Bullish
Timeframe : Daily
Bullish price crossover with adaptative moving average 50
Type : Bullish
Timeframe : Daily
Bullish price crossover with adaptative moving average 100
Type : Bullish
Timeframe : Daily
An assessment of technical indicators does not currently provide any relevant information on the direction of future price movements.
But beware of excesses. The Central Indicators scanner currently detects this:
Previous candle closed under Bollinger bands
Type : Neutral
Timeframe : Daily
Pivot points : price is over resistance 1
Type : Neutral
Timeframe : Daily
Pivot points : price is under support 1
Type : Neutral
Timeframe : Weekly
Ichimoku : price is over the cloud
Type : Bullish
Timeframe : Daily
An analysis of the price chart with the Central Patterns scanner (detector of chart patterns and resistances and supports) shows a result that can have an impact on the price change:
Horizontal resistance is broken
Type : Bullish
Timeframe : Daily
The Central Candlesticks scanner which studies Japanese candlesticks did not detect anything.
| S3 | S2 | S1 | Price | R1 | R2 | R3 | |
|---|---|---|---|---|---|---|---|
| ProTrendLines | 50.21 | 54.22 | 57.66 | 58.56 | 60.74 | 62.25 | 65.44 |
| Change (%) | -14.26% | -7.41% | -1.54% | - | +3.72% | +6.30% | +11.75% |
| Change | -8.35 | -4.34 | -0.90 | - | +2.18 | +3.69 | +6.88 |
| Level | Major | Major | Intermediate | - | Major | Minor | Minor |
To determine price objectives, it is also possible to use the pivot points. Here is the price position in relation to pivot points:
| Pivot points | S3 | S2 | S1 | PP | R1 | R2 | R3 |
|---|---|---|---|---|---|---|---|
| Standard | 53.17 | 54.59 | 55.59 | 57.01 | 58.01 | 59.43 | 60.43 |
| Camarilla | 55.92 | 56.14 | 56.36 | 56.58 | 56.80 | 57.02 | 57.25 |
| Woodie | 52.95 | 54.49 | 55.37 | 56.91 | 57.79 | 59.33 | 60.21 |
| Fibonacci | 54.59 | 55.52 | 56.09 | 57.01 | 57.94 | 58.51 | 59.43 |
| Pivot points | S3 | S2 | S1 | PP | R1 | R2 | R3 |
|---|---|---|---|---|---|---|---|
| Standard | 56.39 | 57.69 | 58.55 | 59.85 | 60.71 | 62.01 | 62.87 |
| Camarilla | 58.81 | 59.00 | 59.20 | 59.40 | 59.60 | 59.80 | 59.99 |
| Woodie | 56.16 | 57.58 | 58.32 | 59.74 | 60.48 | 61.90 | 62.64 |
| Fibonacci | 57.69 | 58.52 | 59.03 | 59.85 | 60.68 | 61.19 | 62.01 |
| Pivot points | S3 | S2 | S1 | PP | R1 | R2 | R3 |
|---|---|---|---|---|---|---|---|
| Standard | 53.34 | 55.16 | 57.82 | 59.64 | 62.30 | 64.12 | 66.78 |
| Camarilla | 59.25 | 59.66 | 60.07 | 60.48 | 60.89 | 61.30 | 61.71 |
| Woodie | 53.76 | 55.37 | 58.24 | 59.85 | 62.72 | 64.33 | 67.20 |
| Fibonacci | 55.16 | 56.87 | 57.93 | 59.64 | 61.35 | 62.41 | 64.12 |
Numerical data
The following are the details of the technical indicators and moving averages that were collected to generate this technical analysis:
| RSI (14): | 48.35 | |
| MACD (12,26,9): | 0.0200 | |
| Directional Movement: | -13.67 | |
| AROON (14): | -35.72 | |
| DEMA (21): | 59.26 | |
| Parabolic SAR (0,02-0,02-0,2): | 60.90 | |
| Elder Ray (13): | -1.21 | |
| Super Trend (3,10): | 60.89 | |
| Zig ZAG (10): | 58.34 | |
| VORTEX (21): | 0.8000 | |
| Stochastique (14,3,5): | 28.04 | |
| TEMA (21): | 58.52 | |
| Williams %R (14): | -56.03 | |
| Chande Momentum Oscillator (20): | -1.60 | |
| Repulse (5,40,3): | -1.7100 | |
| ROCnROLL: | -1 | |
| TRIX (15,9): | 0.1000 | |
| Courbe Coppock: | 0.88 |
| MA7: | 58.78 | |
| MA20: | 59.20 | |
| MA50: | 58.08 | |
| MA100: | 56.07 | |
| MAexp7: | 58.58 | |
| MAexp20: | 59.03 | |
| MAexp50: | 58.14 | |
| MAexp100: | 57.73 | |
| Price / MA7: | -0.37% | |
| Price / MA20: | -1.08% | |
| Price / MA50: | +0.83% | |
| Price / MA100: | +4.44% | |
| Price / MAexp7: | -0.03% | |
| Price / MAexp20: | -0.80% | |
| Price / MAexp50: | +0.72% | |
| Price / MAexp100: | +1.44% |
News
The latest news and videos published on KBC at the time of the analysis were as follows:
- KBC Group: Update regarding the KBC Group share buyback programme
- KBC Group: KBC to call Additional Tier-1 (AT1) Securities it issued in 2019
- KBC Group: Update regarding the KBC Group share buyback programme
- KBC Group: Update regarding the KBC Group share buyback programme
- KBC Group: Update regarding the KBC Group share buyback programme
About author
Online


Add a comment
Comments
0 comments on the analysis KBC - Daily