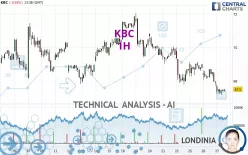
KBC - 1H - Technical analysis published on 11/27/2024 (GMT)
- 105
- 0
Click here for a new analysis!
- Timeframe : 1H
- - Analysis generated on
- Status : LEVEL MAINTAINED

Summary of the analysis

Additional analysis
Quotes
KBC rating 67.50 EUR. The price registered a decrease of -0.59% on the session and was between 67.14 EUR and 67.82 EUR. This implies that the price is at +0.54% from its lowest and at -0.47% from its highest.A bearish gap was detected at the opening by the Central Gaps scanner. There are a lot of sellers and they have the upper hand in the very short term.
Opening Gap DOWN
Type : Bearish
Timeframe : Openning
So that you have an overall view of the price change, here is a table showing the variations over several periods:
Near a new HIGH record (5 years)
Type : Bullish
Timeframe : Weekly
Near a new LOW record (1 month)
Type : Bearish
Timeframe : Weekly
Technical
A technical analysis in 1H of this KBC chart shows a sharp bearish trend. The signals given by moving averages are 92.86% bearish. This strong bearish trend is confirmed by the strong signals currently being given by short-term moving averages. The Central Indicators scanner does not detect any result on moving averages that would impact this trend.
Technical indicators are bearish. There is still some doubt about the decline in the price.
Caution: the Central Indicators scanner currently detects an excess:
CCI indicator is oversold : under -100
Type : Neutral
Timeframe : 1 hour
Williams %R indicator is oversold : under -80
Type : Neutral
Timeframe : 1 hour
Pivot points : price is under support 1
Type : Neutral
Timeframe : 1 hour
The Central Patterns scanner, which studies chart patterns, resistances and supports, has identified these signals:
Near horizontal support
Type : Bullish
Timeframe : 1 hour
Support of channel is broken
Type : Bearish
Timeframe : 1 hour
The Central Candlesticks scanner, specialised in Japanese candlesticks, did not identify any signals.
| S3 | S2 | S1 | Price | R1 | R2 | R3 | |
|---|---|---|---|---|---|---|---|
| ProTrendLines | 65.75 | 66.58 | 67.20 | 67.50 | 68.31 | 69.41 | 70.81 |
| Change (%) | -2.59% | -1.36% | -0.44% | - | +1.20% | +2.83% | +4.90% |
| Change | -1.75 | -0.92 | -0.30 | - | +0.81 | +1.91 | +3.31 |
| Level | Minor | Minor | Intermediate | - | Intermediate | Intermediate | Major |
Attention could also be paid to pivot points to set price objectives:
| Pivot points | S3 | S2 | S1 | PP | R1 | R2 | R3 |
|---|---|---|---|---|---|---|---|
| Standard | 66.53 | 67.13 | 67.51 | 68.11 | 68.49 | 69.09 | 69.47 |
| Camarilla | 67.63 | 67.72 | 67.81 | 67.90 | 67.99 | 68.08 | 68.17 |
| Woodie | 66.43 | 67.08 | 67.41 | 68.06 | 68.39 | 69.04 | 69.37 |
| Fibonacci | 67.13 | 67.50 | 67.73 | 68.11 | 68.48 | 68.71 | 69.09 |
| Pivot points | S3 | S2 | S1 | PP | R1 | R2 | R3 |
|---|---|---|---|---|---|---|---|
| Standard | 62.69 | 65.23 | 66.97 | 69.51 | 71.25 | 73.79 | 75.53 |
| Camarilla | 67.52 | 67.92 | 68.31 | 68.70 | 69.09 | 69.49 | 69.88 |
| Woodie | 62.28 | 65.03 | 66.56 | 69.31 | 70.84 | 73.59 | 75.12 |
| Fibonacci | 65.23 | 66.87 | 67.88 | 69.51 | 71.15 | 72.16 | 73.79 |
| Pivot points | S3 | S2 | S1 | PP | R1 | R2 | R3 |
|---|---|---|---|---|---|---|---|
| Standard | 57.56 | 61.15 | 63.44 | 67.03 | 69.32 | 72.91 | 75.20 |
| Camarilla | 64.11 | 64.65 | 65.19 | 65.73 | 66.27 | 66.81 | 67.35 |
| Woodie | 56.91 | 60.83 | 62.79 | 66.71 | 68.67 | 72.59 | 74.55 |
| Fibonacci | 61.15 | 63.40 | 64.78 | 67.03 | 69.28 | 70.66 | 72.91 |
Numerical data
The following is the status of technical indicators and moving averages registered at the time this technical analysis was created:
| RSI (14): | 34.31 | |
| MACD (12,26,9): | -0.4200 | |
| Directional Movement: | -20.19 | |
| AROON (14): | -57.14 | |
| DEMA (21): | 67.48 | |
| Parabolic SAR (0,02-0,02-0,2): | 68.49 | |
| Elder Ray (13): | -0.39 | |
| Super Trend (3,10): | 68.38 | |
| Zig ZAG (10): | 67.36 | |
| VORTEX (21): | 0.7800 | |
| Stochastique (14,3,5): | 15.63 | |
| TEMA (21): | 67.34 | |
| Williams %R (14): | -85.90 | |
| Chande Momentum Oscillator (20): | -0.92 | |
| Repulse (5,40,3): | -0.1300 | |
| ROCnROLL: | 2 | |
| TRIX (15,9): | -0.0700 | |
| Courbe Coppock: | 3.24 |
| MA7: | 68.94 | |
| MA20: | 68.75 | |
| MA50: | 68.48 | |
| MA100: | 68.05 | |
| MAexp7: | 67.55 | |
| MAexp20: | 68.01 | |
| MAexp50: | 68.63 | |
| MAexp100: | 68.88 | |
| Price / MA7: | -2.09% | |
| Price / MA20: | -1.82% | |
| Price / MA50: | -1.43% | |
| Price / MA100: | -0.81% | |
| Price / MAexp7: | -0.07% | |
| Price / MAexp20: | -0.75% | |
| Price / MAexp50: | -1.65% | |
| Price / MAexp100: | -2.00% |
News
The last news published on KBC at the time of the generation of this analysis was as follows:
- KBC Group: information regarding the traditional annual capital increase reserved for staff
- KBC Group: Notification for bondholders of KBC IFIMA
- KBC Group: Update regarding the KBC Group share buyback programme
- KIBHO Company Announces Landmark Launch of KBC Coin on BitMart Exchange
- KBC Group: Bartel Puelinckx will replace Luc Popelier as KBC Group CFO
About author
Online


Add a comment
Comments
0 comments on the analysis KBC - 1H