| Open: | 85.43 |
| Change: | -1.76 |
| Volume: | 139,277 |
| Low: | 83.47 |
| High: | 86.10 |
| High / Low range: | 2.63 |
| Type: | Stocks |
| Ticker: | SAFE |
| ISIN: |
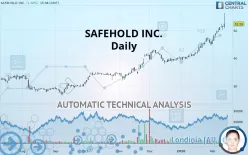
SAFEHOLD INC. NEW - Daily - Technical analysis published on 02/13/2020 (GMT)
- 187
- 0
- 02/13/2020 - 15:55
- Who voted?
Click here for a new analysis!
- Timeframe : Daily
- - Analysis generated on 02/13/2020 - 15:53
- Status : TARGET REACHED

Summary of the analysis

Additional analysis
Quotes
The SAFEHOLD INC. price is 52.28 USD. On the day, this instrument gained +1.38% and was between 50.79 USD and 56.23 USD. This implies that the price is at +2.93% from its lowest and at -7.02% from its highest.A bearish opening was detected by the Central Gaps scanner. Sellers are trying to impose a bearish trend in the very short term.
Bearish opening
Type : Bearish
Timeframe : Openning
A study of price movements over other periods shows the following variations:
New HIGH record (1 year)
Type : Bullish
Timeframe : Weekly
New HIGH record (1st january)
Type : Bullish
Timeframe : Weekly
New HIGH record (1 month)
Type : Bullish
Timeframe : Weekly
Technical
A technical analysis in Daily of this SAFEHOLD INC. chart shows a strongly bullish trend. 92.86% of the signals given by moving averages are bullish. The overall trend is supported by the strong bullish signals from short-term moving averages. The Central Indicators scanner does not detect any result on moving averages that would impact this trend.
In fact, 14 technical indicators on 18 studied are currently bullish. Caution: the Central Indicators scanner currently detects an excess:
RSI indicator is overbought : over 80
Type : Neutral
Timeframe : Daily
CCI indicator is overbought : over 100
Type : Neutral
Timeframe : Daily
MACD indicator: bearish divergence
Type : Bearish
Timeframe : Daily
Williams %R indicator is overbought : over -20
Type : Neutral
Timeframe : Daily
Pivot points : price is over resistance 1
Type : Neutral
Timeframe : Weekly
Pivot points : price is over resistance 2
Type : Neutral
Timeframe : Daily
The analysis of the price chart with Central Patterns scanners does not return any result.
No result was found by the Central Candlesticks scanner on Japanese candlesticks.
| S3 | S2 | S1 | Price | |
|---|---|---|---|---|
| ProTrendLines | 38.56 | 42.73 | 44.96 | 52.28 |
| Change (%) | -26.24% | -18.27% | -14.00% | - |
| Change | -13.72 | -9.55 | -7.32 | - |
| Level | Minor | Intermediate | Major | - |
To determine price objectives, it is also possible to use the pivot points. Here is the price position in relation to pivot points:
| Pivot points | S3 | S2 | S1 | PP | R1 | R2 | R3 |
|---|---|---|---|---|---|---|---|
| Standard | 49.05 | 49.59 | 50.58 | 51.11 | 52.10 | 52.64 | 53.63 |
| Camarilla | 51.15 | 51.29 | 51.43 | 51.57 | 51.71 | 51.85 | 51.99 |
| Woodie | 49.28 | 49.70 | 50.81 | 51.23 | 52.33 | 52.75 | 53.86 |
| Fibonacci | 49.59 | 50.17 | 50.53 | 51.11 | 51.69 | 52.05 | 52.64 |
| Pivot points | S3 | S2 | S1 | PP | R1 | R2 | R3 |
|---|---|---|---|---|---|---|---|
| Standard | 40.44 | 42.72 | 46.22 | 48.50 | 52.00 | 54.28 | 57.78 |
| Camarilla | 48.13 | 48.66 | 49.19 | 49.72 | 50.25 | 50.78 | 51.31 |
| Woodie | 41.05 | 43.03 | 46.83 | 48.81 | 52.61 | 54.59 | 58.39 |
| Fibonacci | 42.72 | 44.93 | 46.29 | 48.50 | 50.71 | 52.07 | 54.28 |
| Pivot points | S3 | S2 | S1 | PP | R1 | R2 | R3 |
|---|---|---|---|---|---|---|---|
| Standard | 31.67 | 35.31 | 40.13 | 43.77 | 48.59 | 52.23 | 57.05 |
| Camarilla | 42.63 | 43.41 | 44.19 | 44.96 | 45.74 | 46.51 | 47.29 |
| Woodie | 32.27 | 35.61 | 40.73 | 44.07 | 49.19 | 52.53 | 57.65 |
| Fibonacci | 35.31 | 38.54 | 40.54 | 43.77 | 47.00 | 49.00 | 52.23 |
Numerical data
The following are the details of the technical indicators and moving averages that were collected to generate this technical analysis:
| RSI (14): | 82.53 | |
| MACD (12,26,9): | 2.6900 | |
| Directional Movement: | 41.47 | |
| AROON (14): | 64.29 | |
| DEMA (21): | 50.90 | |
| Parabolic SAR (0,02-0,02-0,2): | 47.56 | |
| Elder Ray (13): | 4.51 | |
| Super Trend (3,10): | 48.11 | |
| Zig ZAG (10): | 52.56 | |
| VORTEX (21): | 1.2600 | |
| Stochastique (14,3,5): | 82.01 | |
| TEMA (21): | 52.17 | |
| Williams %R (14): | -30.04 | |
| Chande Momentum Oscillator (20): | 5.66 | |
| Repulse (5,40,3): | 2.3000 | |
| ROCnROLL: | 1 | |
| TRIX (15,9): | 0.7700 | |
| Courbe Coppock: | 28.06 |
| MA7: | 51.05 | |
| MA20: | 47.03 | |
| MA50: | 42.98 | |
| MA100: | 38.63 | |
| MAexp7: | 51.29 | |
| MAexp20: | 47.52 | |
| MAexp50: | 43.59 | |
| MAexp100: | 39.72 | |
| Price / MA7: | +2.41% | |
| Price / MA20: | +11.16% | |
| Price / MA50: | +21.64% | |
| Price / MA100: | +35.34% | |
| Price / MAexp7: | +1.93% | |
| Price / MAexp20: | +10.02% | |
| Price / MAexp50: | +19.94% | |
| Price / MAexp100: | +31.62% |
About author

Online


Add a comment
Comments
0 comments on the analysis SAFEHOLD INC. NEW - Daily