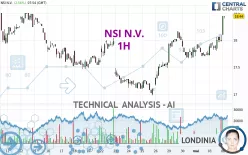
NSI N.V. - 1H - Technical analysis published on 05/06/2024 (GMT)
- 143
- 0
Click here for a new analysis!
- Timeframe : 1H
- - Analysis generated on
- Status : TARGET REACHED

Summary of the analysis

Additional analysis
Quotes
The NSI N.V. price is 18.42 EUR. The price registered an increase of +2.45% on the session and was between 18.10 EUR and 18.44 EUR. This implies that the price is at +1.77% from its lowest and at -0.11% from its highest.A bullish opening was detected by the Central Gaps scanner. Buyers are trying to impose a bullish momentum in the very short term.
Bullish opening
Type : Bullish
Timeframe : Openning
A study of price movements over other periods shows the following variations:
Near a new HIGH record (1st january)
Type : Bullish
Timeframe : Weekly
New HIGH record (1 month)
Type : Bullish
Timeframe : Weekly
Technical
A technical analysis in 1H of this NSI N.V. chart shows a strongly bullish trend. 92.86% of the signals given by moving averages are bullish. The overall trend is supported by the strong bullish signals from short-term moving averages. There is no crossing of moving average by the price or crossing of moving averages between themselves.
In fact, 16 technical indicators on 18 studied are currently positioned bullish. But beware of excesses. The Central Indicators scanner currently detects this:
RSI indicator is overbought : over 70
Type : Neutral
Timeframe : 1 hour
CCI indicator is overbought : over 100
Type : Neutral
Timeframe : 1 hour
Williams %R indicator is overbought : over -20
Type : Neutral
Timeframe : 1 hour
Pivot points : price is over resistance 1
Type : Neutral
Timeframe : Weekly
Pivot points : price is over resistance 2
Type : Neutral
Timeframe : 1 hour
Central Patterns, the market scanner focusing on chart patterns, resistances and supports found these results:
Near horizontal resistance
Type : Bearish
Timeframe : 1 hour
Resistance of channel is broken
Type : Bullish
Timeframe : 1 hour
The Central Candlesticks scanner which studies Japanese candlesticks did not detect anything.
| S3 | S2 | S1 | Price | R1 | R2 | R3 | |
|---|---|---|---|---|---|---|---|
| ProTrendLines | 17.45 | 17.73 | 18.21 | 18.42 | 18.46 | 18.77 | 19.02 |
| Change (%) | -5.27% | -3.75% | -1.14% | - | +0.22% | +1.90% | +3.26% |
| Change | -0.97 | -0.69 | -0.21 | - | +0.04 | +0.35 | +0.60 |
| Level | Major | Intermediate | Intermediate | - | Major | Minor | Intermediate |
Pivot points can also be used to set your price objectives. Here is the price situation in relation to pivot points:
| Pivot points | S3 | S2 | S1 | PP | R1 | R2 | R3 |
|---|---|---|---|---|---|---|---|
| Standard | 17.39 | 17.55 | 17.77 | 17.93 | 18.15 | 18.31 | 18.53 |
| Camarilla | 17.88 | 17.91 | 17.95 | 17.98 | 18.02 | 18.05 | 18.09 |
| Woodie | 17.41 | 17.57 | 17.79 | 17.95 | 18.17 | 18.33 | 18.55 |
| Fibonacci | 17.55 | 17.70 | 17.79 | 17.93 | 18.08 | 18.17 | 18.31 |
| Pivot points | S3 | S2 | S1 | PP | R1 | R2 | R3 |
|---|---|---|---|---|---|---|---|
| Standard | 17.07 | 17.33 | 17.65 | 17.91 | 18.23 | 18.49 | 18.81 |
| Camarilla | 17.82 | 17.87 | 17.93 | 17.98 | 18.03 | 18.09 | 18.14 |
| Woodie | 17.11 | 17.35 | 17.69 | 17.93 | 18.27 | 18.51 | 18.85 |
| Fibonacci | 17.33 | 17.55 | 17.69 | 17.91 | 18.13 | 18.27 | 18.49 |
| Pivot points | S3 | S2 | S1 | PP | R1 | R2 | R3 |
|---|---|---|---|---|---|---|---|
| Standard | 15.45 | 16.09 | 16.93 | 17.57 | 18.41 | 19.05 | 19.89 |
| Camarilla | 17.37 | 17.51 | 17.64 | 17.78 | 17.92 | 18.05 | 18.19 |
| Woodie | 15.56 | 16.14 | 17.04 | 17.62 | 18.52 | 19.10 | 20.00 |
| Fibonacci | 16.09 | 16.65 | 17.00 | 17.57 | 18.13 | 18.48 | 19.05 |
Numerical data
The following are the details of the technical indicators and moving averages that were collected to generate this technical analysis:
| RSI (14): | 72.15 | |
| MACD (12,26,9): | 0.1000 | |
| Directional Movement: | 26.43 | |
| AROON (14): | 100.00 | |
| DEMA (21): | 18.06 | |
| Parabolic SAR (0,02-0,02-0,2): | 17.85 | |
| Elder Ray (13): | 0.26 | |
| Super Trend (3,10): | 17.82 | |
| Zig ZAG (10): | 18.40 | |
| VORTEX (21): | 1.0900 | |
| Stochastique (14,3,5): | 84.44 | |
| TEMA (21): | 18.08 | |
| Williams %R (14): | 0.00 | |
| Chande Momentum Oscillator (20): | 0.74 | |
| Repulse (5,40,3): | 2.4700 | |
| ROCnROLL: | 1 | |
| TRIX (15,9): | 0.0500 | |
| Courbe Coppock: | 3.07 |
| MA7: | 17.80 | |
| MA20: | 17.40 | |
| MA50: | 17.88 | |
| MA100: | 18.08 | |
| MAexp7: | 18.08 | |
| MAexp20: | 17.93 | |
| MAexp50: | 17.76 | |
| MAexp100: | 17.61 | |
| Price / MA7: | +3.48% | |
| Price / MA20: | +5.86% | |
| Price / MA50: | +3.02% | |
| Price / MA100: | +1.88% | |
| Price / MAexp7: | +1.88% | |
| Price / MAexp20: | +2.73% | |
| Price / MAexp50: | +3.72% | |
| Price / MAexp100: | +4.60% |
About author
Online


Add a comment
Comments
0 comments on the analysis NSI N.V. - 1H