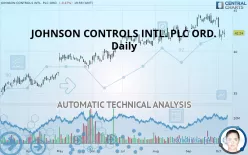
JOHNSON CONTROLS INTL. PLC ORD. - Daily - Technical analysis published on 10/08/2019 (GMT)
- 243
- 0
- Who voted?
Click here for a new analysis!
- Timeframe : Daily
- - Analysis generated on
- Status : TARGET REACHED

Summary of the analysis

Additional analysis
Quotes
The JOHNSON CONTROLS INTL. PLC ORD. price is 42.24 USD. The price registered a decrease of -0.47% on the session with the lowest point at 41.74 USD and the highest point at 42.65 USD. The deviation from the price is +1.20% for the low point and -0.96% for the high point.The Central Gaps scanner detects a bearish opening. A small advantage for sellers in the very short term.
Bearish opening
Type : Bearish
Timeframe : Openning
So that you have an overall view of the price change, here is a table showing the variations over several periods:
Near a new HIGH record (1 year)
Type : Bullish
Timeframe : Weekly
Near a new HIGH record (1st january)
Type : Bullish
Timeframe : Weekly
Technical
Technical analysis of JOHNSON CONTROLS INTL. PLC ORD. in Daily shows an overall slightly bullish trend. 57.14% of the signals given by moving averages are bullish. Caution: a reversal of the trend could be possible given the strong bearish signals of short-term moving averages. The Central Indicators scanner detects a bullish signal on moving averages that could impact this trend:
Bullish price crossover with adaptative moving average 100
Type : Bullish
Timeframe : Daily
In fact, Central Analyzer took into account 18 technical indicators and the result was as follows: 4 are bullish, 5 are neutral and 9 are bearish. Caution: the Central Indicators scanner currently detects an excess:
CCI indicator is oversold : under -100
Type : Neutral
Timeframe : Daily
Price is back over the pivot point
Type : Bullish
Timeframe : Daily
Price is back under the pivot point
Type : Bearish
Timeframe : Weekly
Central Patterns, the market scanner focusing on chart patterns, resistances and supports found this result:
Near support of triangle
Type : Bullish
Timeframe : Daily
The Central Candlesticks scanner, specialised in Japanese candlesticks, did not identify any signals.
| S3 | S2 | S1 | Price | R1 | R2 | R3 | |
|---|---|---|---|---|---|---|---|
| ProTrendLines | 38.25 | 40.00 | 41.34 | 42.24 | 44.39 | 48.90 | 53.59 |
| Change (%) | -9.45% | -5.30% | -2.13% | - | +5.09% | +15.77% | +26.87% |
| Change | -3.99 | -2.24 | -0.90 | - | +2.15 | +6.66 | +11.35 |
| Level | Minor | Major | Major | - | Major | Intermediate | Intermediate |
Pivot points can also be used to set your price objectives. Here is the price situation in relation to pivot points:
| Pivot points | S3 | S2 | S1 | PP | R1 | R2 | R3 |
|---|---|---|---|---|---|---|---|
| Standard | 41.52 | 41.76 | 42.10 | 42.34 | 42.68 | 42.92 | 43.26 |
| Camarilla | 42.28 | 42.33 | 42.39 | 42.44 | 42.49 | 42.55 | 42.60 |
| Woodie | 41.57 | 41.79 | 42.15 | 42.37 | 42.73 | 42.95 | 43.31 |
| Fibonacci | 41.76 | 41.98 | 42.12 | 42.34 | 42.56 | 42.70 | 42.92 |
| Pivot points | S3 | S2 | S1 | PP | R1 | R2 | R3 |
|---|---|---|---|---|---|---|---|
| Standard | 38.26 | 39.80 | 41.12 | 42.66 | 43.98 | 45.52 | 46.84 |
| Camarilla | 41.65 | 41.92 | 42.18 | 42.44 | 42.70 | 42.96 | 43.23 |
| Woodie | 38.15 | 39.75 | 41.01 | 42.61 | 43.87 | 45.47 | 46.73 |
| Fibonacci | 39.80 | 40.89 | 41.57 | 42.66 | 43.75 | 44.43 | 45.52 |
| Pivot points | S3 | S2 | S1 | PP | R1 | R2 | R3 |
|---|---|---|---|---|---|---|---|
| Standard | 39.05 | 40.32 | 42.11 | 43.38 | 45.16 | 46.43 | 48.22 |
| Camarilla | 43.05 | 43.33 | 43.61 | 43.89 | 44.17 | 44.45 | 44.73 |
| Woodie | 39.31 | 40.45 | 42.36 | 43.51 | 45.42 | 46.56 | 48.47 |
| Fibonacci | 40.32 | 41.49 | 42.21 | 43.38 | 44.55 | 45.27 | 46.43 |
Numerical data
The following are the details of the technical indicators and moving averages that were collected to generate this technical analysis:
| RSI (14): | 43.11 | |
| MACD (12,26,9): | -0.0400 | |
| Directional Movement: | -9.77 | |
| AROON (14): | -50.00 | |
| DEMA (21): | 43.07 | |
| Parabolic SAR (0,02-0,02-0,2): | 43.87 | |
| Elder Ray (13): | -0.72 | |
| Super Trend (3,10): | 44.05 | |
| Zig ZAG (10): | 42.24 | |
| VORTEX (21): | 0.9400 | |
| Stochastique (14,3,5): | 27.09 | |
| TEMA (21): | 42.66 | |
| Williams %R (14): | -72.81 | |
| Chande Momentum Oscillator (20): | -1.79 | |
| Repulse (5,40,3): | 0.0100 | |
| ROCnROLL: | -1 | |
| TRIX (15,9): | 0.0900 | |
| Courbe Coppock: | 4.71 |
| MA7: | 42.73 | |
| MA20: | 43.42 | |
| MA50: | 42.51 | |
| MA100: | 41.18 | |
| MAexp7: | 42.62 | |
| MAexp20: | 42.97 | |
| MAexp50: | 42.44 | |
| MAexp100: | 41.12 | |
| Price / MA7: | -1.15% | |
| Price / MA20: | -2.72% | |
| Price / MA50: | -0.64% | |
| Price / MA100: | +2.57% | |
| Price / MAexp7: | -0.89% | |
| Price / MAexp20: | -1.70% | |
| Price / MAexp50: | -0.47% | |
| Price / MAexp100: | +2.72% |
News
Don"t forget to follow the news on JOHNSON CONTROLS INTL. PLC ORD.. At the time of publication of this analysis, the latest news was as follows:
About author

Online


Add a comment
Comments
0 comments on the analysis JOHNSON CONTROLS INTL. PLC ORD. - Daily