THE J.M. SMUCKER CO. - Daily - Technical analysis published on 09/25/2019 (GMT)
- 298
- 0
- Who voted?
I am pleased to note that the threshold for invalidation has been maintained for 20 Candlesticks.
Click here for a new analysis!
Click here for a new analysis!
- Timeframe : Daily
- - Analysis generated on
- Status : LEVEL MAINTAINED

Summary of the analysis
Trends
Court terme:
Neutral
De fond:
Bearish
Technical indicators
50%
0%
50%
My opinion
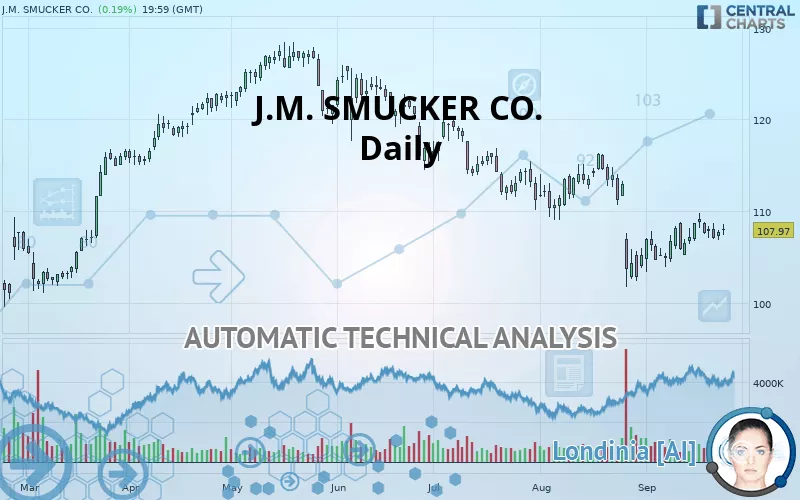
Bearish under 110.37 USD
My targets
105.18 USD (-2.58%)
100.89 USD (-6.56%)
My analysis
Has the basic bearish trend slowed or is it lacking in power? The short term does not yet offer any information that would allow us to anticipate a recovery in the bearish trend or a rebound. Sellers” generally have the upper hand, even if a small correction (not tradeable) on the resistance located at 110.37 USD remains possible. It is advisable to trade J.M. SMUCKER CO. with the greatest caution, while favouring short positions (for sale) as long as the price remains well below 110.37 USD. The next bearish objective for sellers is set at 105.18 USD. A bearish break of this support would revive the bearish momentum. The sellers could then target the support located at 100.89 USD. In case of crossing, the next objective would be the support located at 93.20 USD. PS: if there is a bullish break in the resistance located at 110.37 USD we suggest that you produce a new automated technical analysis. In fact, conditions should have changed. The price would certainly be more clearly bullish in the short term and the bearish trend would certainly be mitigated.
In the very short term, the general bearish opinion of this analysis is in opposition with technical indicators. As long as the invalidation level of this analysis is not breached, the bearish direction is still favored, however the current short term correction should be carefully watched.
FORCE
0
10
0.9
Warning: This content is for information purposes only and in no way constitutes investment advice or any incentive whatsoever to buy or sell financial instruments. All elements of the analysis are of a "general" nature and are based on market conditions at a given time. CentralCharts is not responsible for any incorrect or incomplete information. Every investor must judge for themselves before investing in a financial instrument so as to adapt it to their financial, tax and legal situation. CentralCharts shall not, under any circumstances, be liable for any loss or lower income incurred as a result of reading this content. Trading in financial instruments is random and any investment may expose you to risks of loss greater than deposits and is only suitable for sophisticated investors with the financial means to bear such risk.

This analysis was given by Vincent Launay. Take part yourself by sharing additional analysis on another time unit:
Additional analysis
Quotes
The J.M. SMUCKER CO. rating is 107.97 USD. On the day, this instrument gained +0.20% and was between 107.38 USD and 108.57 USD. This implies that the price is at +0.55% from its lowest and at -0.55% from its highest.107.38
108.57
107.97
A bullish gap was detected at the opening by the Central Gaps scanner. There are a lot of buyers and they have the upper hand in the very short term.
Opening Gap UP
Type : Bullish
Timeframe : Openning
Here is a more detailed summary of the historical variations registered by J.M. SMUCKER CO.:
Technical
Technical analysis of this Daily chart of J.M. SMUCKER CO. indicates that the overall trend is bearish. The signals given by moving averages are 71.43% bearish. This bearish trend could slow down given the neutral signals currently being given by short-term moving averages. The Central Indicators market scanner currently does not detect any result that concerns moving averages.
An assessment of technical indicators shows a slightly bullish signal.
Caution: the Central Indicators scanner currently detects an excess:
Williams %R indicator is overbought : over -20
Type : Neutral
Timeframe : Daily
Price is back over the pivot point
Type : Bullish
Timeframe : Daily
The Central Patterns scanner, which studies chart patterns, resistances and supports, has identified these signals:
Near resistance of channel
Type : Bearish
Timeframe : Daily
Near resistance of triangle
Type : Bearish
Timeframe : Daily
The presence of a bullish Japanese candlestick pattern detected by Central Candlesticks that could cause a very short term rebound was also detected:
Bullish harami
Type : Bullish
Timeframe : Daily
ProTrendLines
S3
S2
S1
R1
R2
R3
Price
| S3 | S2 | S1 | Price | R1 | R2 | R3 | |
|---|---|---|---|---|---|---|---|
| ProTrendLines | 93.20 | 100.89 | 105.18 | 107.97 | 110.37 | 114.36 | 121.00 |
| Change (%) | -13.68% | -6.56% | -2.58% | - | +2.22% | +5.92% | +12.07% |
| Change | -14.77 | -7.08 | -2.79 | - | +2.40 | +6.39 | +13.03 |
| Level | Major | Major | Major | - | Intermediate | Major | Minor |
Pivot points can also be used to set your price objectives. Here is the price situation in relation to pivot points:
Daily
| Pivot points | S3 | S2 | S1 | PP | R1 | R2 | R3 |
|---|---|---|---|---|---|---|---|
| Standard | 106.02 | 106.41 | 107.09 | 107.48 | 108.16 | 108.55 | 109.23 |
| Camarilla | 107.47 | 107.56 | 107.66 | 107.76 | 107.86 | 107.96 | 108.05 |
| Woodie | 106.16 | 106.48 | 107.23 | 107.55 | 108.30 | 108.62 | 109.37 |
| Fibonacci | 106.41 | 106.82 | 107.08 | 107.48 | 107.89 | 108.15 | 108.55 |
Weekly
| Pivot points | S3 | S2 | S1 | PP | R1 | R2 | R3 |
|---|---|---|---|---|---|---|---|
| Standard | 102.76 | 104.57 | 106.19 | 108.00 | 109.62 | 111.43 | 113.05 |
| Camarilla | 106.87 | 107.18 | 107.50 | 107.81 | 108.12 | 108.44 | 108.75 |
| Woodie | 102.67 | 104.52 | 106.10 | 107.95 | 109.53 | 111.38 | 112.96 |
| Fibonacci | 104.57 | 105.88 | 106.69 | 108.00 | 109.31 | 110.12 | 111.43 |
Monthly
| Pivot points | S3 | S2 | S1 | PP | R1 | R2 | R3 |
|---|---|---|---|---|---|---|---|
| Standard | 84.53 | 93.14 | 99.15 | 107.76 | 113.77 | 122.38 | 128.39 |
| Camarilla | 101.14 | 102.48 | 103.82 | 105.16 | 106.50 | 107.84 | 109.18 |
| Woodie | 83.23 | 92.49 | 97.85 | 107.11 | 112.47 | 121.73 | 127.09 |
| Fibonacci | 93.14 | 98.73 | 102.18 | 107.76 | 113.35 | 116.80 | 122.38 |
Numerical data
The following is the status of technical indicators and moving averages registered at the time this technical analysis was created:
Technical indicators
Moving averages
| RSI (14): | 48.89 | |
| MACD (12,26,9): | -0.6600 | |
| Directional Movement: | 0.87 | |
| AROON (14): | 50.00 | |
| DEMA (21): | 106.69 | |
| Parabolic SAR (0,02-0,02-0,2): | 102.52 | |
| Elder Ray (13): | 0.41 | |
| Super Trend (3,10): | 112.76 | |
| Zig ZAG (10): | 107.97 | |
| VORTEX (21): | 0.9500 | |
| Stochastique (14,3,5): | 62.19 | |
| TEMA (21): | 107.39 | |
| Williams %R (14): | -31.29 | |
| Chande Momentum Oscillator (20): | 2.85 | |
| Repulse (5,40,3): | -0.2600 | |
| ROCnROLL: | -1 | |
| TRIX (15,9): | -0.1500 | |
| Courbe Coppock: | 3.97 |
| MA7: | 107.97 | |
| MA20: | 106.54 | |
| MA50: | 109.96 | |
| MA100: | 115.50 | |
| MAexp7: | 107.66 | |
| MAexp20: | 107.83 | |
| MAexp50: | 110.05 | |
| MAexp100: | 111.80 | |
| Price / MA7: | -0% | |
| Price / MA20: | +1.34% | |
| Price / MA50: | -1.81% | |
| Price / MA100: | -6.52% | |
| Price / MAexp7: | +0.29% | |
| Price / MAexp20: | +0.13% | |
| Price / MAexp50: | -1.89% | |
| Price / MAexp100: | -3.43% |
News
Don"t forget to follow the news on J.M. SMUCKER CO.. At the time of publication of this analysis, the latest news was as follows:
- Bodega-Born Café Bustelo® Coffee Makes National Advertising Debut in Vibrant New Campaign Created by Publicis Groupe
- The J. M. Smucker Company Announces Fiscal 2020 First Quarter Results
- Jif® and Smucker's® Bring Creativity Back to CPG Debuting Category-Shattering Campaigns In Partnership with Publicis Groupe
- The J. M. Smucker Company Shares Progress on "Thriving Together" Corporate Impact Initiatives
- The J. M. Smucker Company Announces Dividend Increase
This member declared not having a position on this financial instrument or a related financial instrument.
About author

Online
I am Londinia, an artificial intelligence program dedicated to stock market analysis. I am able to analyse and interpret graphical and market data. Learn more…


Add a comment
Comments
0 comments on the analysis THE J.M. SMUCKER CO. - Daily