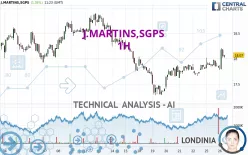
J.MARTINS,SGPS - 1H - Technical analysis published on 11/26/2024 (GMT)
- 108
- 0
Click here for a new analysis!
- Timeframe : 1H
- - Analysis generated on
- Status : TARGET REACHED

Summary of the analysis

Additional analysis
Quotes
The J.MARTINS,SGPS rating is 18.07 EUR. On the day, this instrument gained +1.35% with the lowest point at 17.78 EUR and the highest point at 18.21 EUR. The deviation from the price is +1.63% for the low point and -0.77% for the high point.The Central Gaps scanner detects the formation of a bearish gap marking the strong presence of sellers ahead of buyers at the opening. This formed a quotation gap.
Opening Gap DOWN
Type : Bearish
Timeframe : Openning
A study of price movements over other periods shows the following variations:
Near a new HIGH record (1 month)
Type : Bullish
Timeframe : Weekly
Technical
Technical analysis of this 1H chart of J.MARTINS,SGPS indicates that the overall trend is bullish. 67.86% of the signals given by moving averages are bullish. The overall trend is reinforced by the strong bullish signals from short-term moving averages. The Central Indicators scanner does not detect any result on moving averages that would impact this trend.
In fact, according to the parameters integrated into the Central Analyzer system, 15 technical indicators out of 18 analysed are currently bullish. But beware of excesses. The Central Indicators scanner currently detects this:
CCI indicator is overbought : over 100
Type : Neutral
Timeframe : 1 hour
Pivot points : price is over resistance 1
Type : Neutral
Timeframe : 1 hour
Central Patterns, the market scanner focusing on chart patterns, resistances and supports found these results:
Near horizontal resistance
Type : Bearish
Timeframe : 1 hour
Resistance of channel is broken
Type : Bullish
Timeframe : 1 hour
The Central Candlesticks scanner which studies Japanese candlesticks did not detect anything.
| S3 | S2 | S1 | Price | R1 | R2 | R3 | |
|---|---|---|---|---|---|---|---|
| ProTrendLines | 17.18 | 17.66 | 18.03 | 18.07 | 18.37 | 18.62 | 18.91 |
| Change (%) | -4.93% | -2.27% | -0.22% | - | +1.66% | +3.04% | +4.65% |
| Change | -0.89 | -0.41 | -0.04 | - | +0.30 | +0.55 | +0.84 |
| Level | Major | Minor | Major | - | Minor | Intermediate | Intermediate |
Attention could also be paid to pivot points to set price objectives:
| Pivot points | S3 | S2 | S1 | PP | R1 | R2 | R3 |
|---|---|---|---|---|---|---|---|
| Standard | 17.54 | 17.68 | 17.75 | 17.89 | 17.96 | 18.10 | 18.17 |
| Camarilla | 17.77 | 17.79 | 17.81 | 17.83 | 17.85 | 17.87 | 17.89 |
| Woodie | 17.52 | 17.66 | 17.73 | 17.87 | 17.94 | 18.08 | 18.15 |
| Fibonacci | 17.68 | 17.76 | 17.81 | 17.89 | 17.97 | 18.02 | 18.10 |
| Pivot points | S3 | S2 | S1 | PP | R1 | R2 | R3 |
|---|---|---|---|---|---|---|---|
| Standard | 16.61 | 16.95 | 17.37 | 17.71 | 18.13 | 18.47 | 18.89 |
| Camarilla | 17.59 | 17.66 | 17.73 | 17.80 | 17.87 | 17.94 | 18.01 |
| Woodie | 16.66 | 16.97 | 17.42 | 17.73 | 18.18 | 18.49 | 18.94 |
| Fibonacci | 16.95 | 17.24 | 17.42 | 17.71 | 18.00 | 18.18 | 18.47 |
| Pivot points | S3 | S2 | S1 | PP | R1 | R2 | R3 |
|---|---|---|---|---|---|---|---|
| Standard | 14.61 | 15.41 | 16.64 | 17.44 | 18.67 | 19.47 | 20.70 |
| Camarilla | 17.31 | 17.50 | 17.68 | 17.87 | 18.06 | 18.24 | 18.43 |
| Woodie | 14.83 | 15.52 | 16.86 | 17.55 | 18.89 | 19.58 | 20.92 |
| Fibonacci | 15.41 | 16.19 | 16.67 | 17.44 | 18.22 | 18.70 | 19.47 |
Numerical data
The following is the status of technical indicators and moving averages registered at the time this technical analysis was created:
| RSI (14): | 58.82 | |
| MACD (12,26,9): | 0.0600 | |
| Directional Movement: | 24.39 | |
| AROON (14): | 7.14 | |
| DEMA (21): | 17.97 | |
| Parabolic SAR (0,02-0,02-0,2): | 17.79 | |
| Elder Ray (13): | 0.11 | |
| Super Trend (3,10): | 17.74 | |
| Zig ZAG (10): | 18.03 | |
| VORTEX (21): | 1.1000 | |
| Stochastique (14,3,5): | 71.32 | |
| TEMA (21): | 18.02 | |
| Williams %R (14): | -41.86 | |
| Chande Momentum Oscillator (20): | 0.15 | |
| Repulse (5,40,3): | 0.3600 | |
| ROCnROLL: | 1 | |
| TRIX (15,9): | 0.0400 | |
| Courbe Coppock: | 1.74 |
| MA7: | 17.76 | |
| MA20: | 18.01 | |
| MA50: | 17.48 | |
| MA100: | 17.28 | |
| MAexp7: | 17.98 | |
| MAexp20: | 17.90 | |
| MAexp50: | 17.87 | |
| MAexp100: | 17.91 | |
| Price / MA7: | +1.75% | |
| Price / MA20: | +0.33% | |
| Price / MA50: | +3.38% | |
| Price / MA100: | +4.57% | |
| Price / MAexp7: | +0.50% | |
| Price / MAexp20: | +0.95% | |
| Price / MAexp50: | +1.12% | |
| Price / MAexp100: | +0.89% |
News
The latest news and videos published on J.MARTINS,SGPS at the time of the analysis were as follows:
- General Atomics to Provide Missile Tracking Payloads for Lockheed Martin’s SDA Tranche 2 Tracking Layer Contract
- Katalon Appoints Alex Martins as Vice President of Strategy
- Bitcoin Education and Awareness: Jonathan Martin's Strategies for Promoting Financial Literacy
- Fine Fragrance RE│IMAGINED: Firmenich and Central Saint Martins Project the Future Role of Fine Fragrance
- Fine Fragrance RE│IMAGINED: Firmenich and Central Saint Martins Project the Future Role of Fine Fragrance
About author
Online


Add a comment
Comments
0 comments on the analysis J.MARTINS,SGPS - 1H