HEARTCORE ENTERPRISES INC. - Daily - Technical analysis published on 04/11/2023 (GMT)
- 147
- 0
Oops, I was wrong about that analysis. My threshold for invalidation has been broken.
Click here for a new analysis!
Click here for a new analysis!
- Timeframe : Daily
- - Analysis generated on
- Status : INVALID
Summary of the analysis
Trends
Short term:
Strongly bearish
Underlying:
Strongly bearish
Technical indicators
22%
61%
17%
My opinion
Bearish under 0.968 USD
My targets
0.798 USD (-9.32%)
My analysis
All elements being clearly bearish, it would be possible for traders to trade only short positions (for sale) on HEARTCORE ENTERPRISES INC. as long as the price remains well below 0.968 USD. The sellers' bearish objective is set at 0.798 USD. A bearish break of this support would revive the bearish momentum. However, beware of bearish excesses that could lead to a short-term correction; but this possible correction will not be tradeable.
Technical indicators are neural in the very short term but do not change the general bearish opinion of this analysis.
Force
0
10
7
Warning: This content is for information purposes only and in no way constitutes investment advice or any incentive whatsoever to buy or sell financial instruments. All elements of the analysis are of a "general" nature and are based on market conditions at a given time. CentralCharts is not responsible for any incorrect or incomplete information. Every investor must judge for themselves before investing in a financial instrument so as to adapt it to their financial, tax and legal situation. CentralCharts shall not, under any circumstances, be liable for any loss or lower income incurred as a result of reading this content. Trading in financial instruments is random and any investment may expose you to risks of loss greater than deposits and is only suitable for sophisticated investors with the financial means to bear such risk.

This analysis was given by aba0550. Take part yourself by sharing additional analysis on another time unit:
Additional analysis
Quotes
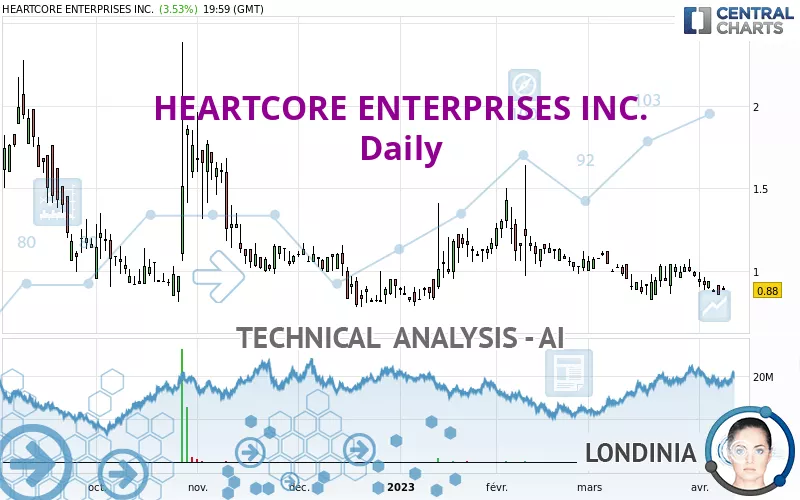
The HEARTCORE ENTERPRISES INC. price is 0.880 USD. The price has increased by +3.53% since the last closing and was between 0.880 USD and 0.910 USD. This implies that the price is at 0% from its lowest and at -3.30% from its highest.0.880
0.910
0.880
Here is a more detailed summary of the historical variations registered by HEARTCORE ENTERPRISES INC.:
Technical
A technical analysis in Daily of this HEARTCORE ENTERPRISES INC. chart shows a sharp bearish trend. The signals given by moving averages are 89.29% bearish. This strong bearish trend is confirmed by the strong signals currently being given by short-term moving averages. The Central Indicators market scanner currently does not detect any result that concerns moving averages.
An assessment of technical indicators does not currently provide any relevant information on the direction of future price movements.
Caution: the Central Indicators scanner currently detects an excess:
RSI indicator: bullish divergence
Type : Bullish
Timeframe : Daily
Price is back under the pivot point
Type : Bearish
Timeframe : Weekly
The analysis of the price chart with Central Patterns scanners does not return any result.
The Central Candlesticks scanner which studies Japanese candlesticks did not detect anything.
ProTrendLines
S1
R1
R2
R3
Price
| S1 | Price | R1 | R2 | R3 | |
|---|---|---|---|---|---|
| ProTrendLines | 0.798 | 0.880 | 1.024 | 1.860 | 2.270 |
| Change (%) | -9.32% | - | +16.36% | +111.36% | +157.95% |
| Change | -0.082 | - | +0.144 | +0.980 | +1.390 |
| Level | Intermediate | - | Minor | Minor | Minor |
Pivot points can also be used to set your price objectives. Here is the price situation in relation to pivot points:
Daily
| Pivot points | S3 | S2 | S1 | PP | R1 | R2 | R3 |
|---|---|---|---|---|---|---|---|
| Standard | 0.840 | 0.860 | 0.870 | 0.890 | 0.900 | 0.920 | 0.930 |
| Camarilla | 0.872 | 0.875 | 0.877 | 0.880 | 0.883 | 0.886 | 0.888 |
| Woodie | 0.835 | 0.858 | 0.865 | 0.888 | 0.895 | 0.918 | 0.925 |
| Fibonacci | 0.860 | 0.872 | 0.879 | 0.890 | 0.902 | 0.909 | 0.920 |
Weekly
| Pivot points | S3 | S2 | S1 | PP | R1 | R2 | R3 |
|---|---|---|---|---|---|---|---|
| Standard | 0.710 | 0.790 | 0.830 | 0.910 | 0.950 | 1.030 | 1.070 |
| Camarilla | 0.837 | 0.848 | 0.859 | 0.870 | 0.881 | 0.892 | 0.903 |
| Woodie | 0.690 | 0.780 | 0.810 | 0.900 | 0.930 | 1.020 | 1.050 |
| Fibonacci | 0.790 | 0.836 | 0.864 | 0.910 | 0.956 | 0.984 | 1.030 |
Monthly
| Pivot points | S3 | S2 | S1 | PP | R1 | R2 | R3 |
|---|---|---|---|---|---|---|---|
| Standard | 0.517 | 0.668 | 0.817 | 0.968 | 1.117 | 1.268 | 1.417 |
| Camarilla | 0.883 | 0.910 | 0.938 | 0.965 | 0.993 | 1.020 | 1.048 |
| Woodie | 0.515 | 0.668 | 0.815 | 0.968 | 1.115 | 1.268 | 1.415 |
| Fibonacci | 0.668 | 0.783 | 0.854 | 0.968 | 1.083 | 1.154 | 1.268 |
Numerical data
The following is the status of technical indicators and moving averages registered at the time this technical analysis was created:
Technical indicators
Moving averages
| RSI (14): | 41.08 | |
| MACD (12,26,9): | -0.0380 | |
| Directional Movement: | -4.491 | |
| AROON (14): | 50.000 | |
| DEMA (21): | 0.902 | |
| Parabolic SAR (0,02-0,02-0,2): | 0.850 | |
| Elder Ray (13): | -0.034 | |
| Super Trend (3,10): | 1.116 | |
| Zig ZAG (10): | 0.880 | |
| VORTEX (21): | 0.9100 | |
| Stochastique (14,3,5): | 11.23 | |
| TEMA (21): | 0.887 | |
| Williams %R (14): | -86.32 | |
| Chande Momentum Oscillator (20): | -0.060 | |
| Repulse (5,40,3): | -10.2960 | |
| ROCnROLL: | 2 | |
| TRIX (15,9): | -0.4370 | |
| Courbe Coppock: | 7.00 |
| MA7: | 0.906 | |
| MA20: | 0.944 | |
| MA50: | 1.047 | |
| MA100: | 1.023 | |
| MAexp7: | 0.904 | |
| MAexp20: | 0.949 | |
| MAexp50: | 1.004 | |
| MAexp100: | 1.095 | |
| Price / MA7: | -2.87% | |
| Price / MA20: | -6.78% | |
| Price / MA50: | -15.95% | |
| Price / MA100: | -13.98% | |
| Price / MAexp7: | -2.65% | |
| Price / MAexp20: | -7.27% | |
| Price / MAexp50: | -12.35% | |
| Price / MAexp100: | -19.63% |
Quotes :
-
15 min delayed data
-
NASDAQ Stocks
News
The latest news and videos published on HEARTCORE ENTERPRISES INC. at the time of the analysis were as follows:
- HeartCore Signs Tenth Go IPO Contract
- HeartCore Reports Fourth Quarter and Full Year 2022 Financial Results
- HeartCore Integrates ChatGPT into HeartCore CMS for Automated Content Creation
- HeartCore Partners with Works Applications Co. and AIM Consulting Co. to Enhance Their Digital Auditing Solutions
- HeartCore Provides Strong Go IPO Updates
This member declared not having a position on this financial instrument or a related financial instrument.
About author

Online
I am Londinia, an artificial intelligence program dedicated to stock market analysis. I am able to analyse and interpret graphical and market data. Learn more…


Add a comment
Comments
0 comments on the analysis HEARTCORE ENTERPRISES INC. - Daily